If you're a frequent user of jsbin, you might have noticed that on the odd occasion that it was unreachable. I've got alarms in place that notify me of problems, but the root cause was unknown to me. The result looked like an infinite loop, but how to find that code was a mission.

Getting help
I've posted a few times on twitter to attempt to get some help, but really 140 characters doesn't express the problem at all.
The problem boils down to: how do you find an infinite loop on server-side code when you can't replicate the bug. Tools like nodetime and New Relic wouldn't work because the code would be stuck in a tight loop which these tools wouldn't have breathing space to request a memory snapshot. i.e. it's complicated!
Finally I posted on Google Plus (rather than here because it was more of a throw away question), and this is when Vyacheslav Egorov replied (who I understand worked on the V8 engine ).
His suggestion was to attach to the process, and run a core dump. Basically voodoo black magic ninja server stuff I didn't quite understand - but he posted directions!
A huge, huge thanks to Vyacheslav for his solution - what a star!
Getting a stacktrace from an infinite loop
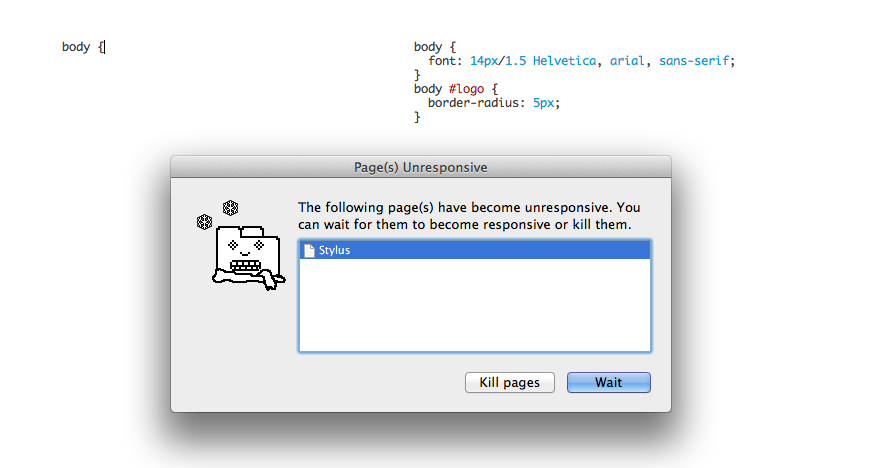
You need gdb to attach to the process, set a breakpoint in the next runtime
stack guard (I believe this is the Chrome "kill/wait" box),
then continue execution.
The process breaks correctly, then you insert an exception that causes a full
(and super detailed) stacktrace (this is in STDERR - or STDOUT - but it's not in
the gdb, so I found it in my server logs).
This is Vyacheslav's gist that showed the process, and his explanation (in the comments towards the end):
$ cat test.js
function foo () { while (true) { } }
function bar () { return foo(); }
bar();
$ node test.js &
$ gdb attach $(pidof node)
0x00000bf778c63d5f in ?? ()
(gdb) b v8::internal::Runtime_StackGuard
Breakpoint 1 at 0x84a1f0
(gdb) print 'v8::V8::TerminateExecution'(0)
$2 = 0
(gdb) c
Continuing.

Breakpoint 1, 0x000000000084a1f0 in v8::internal::Runtime_StackGuard(v8::internal::Arguments, v8::internal::Isolate*) ()
(gdb) print V8_Fatal("a", 11, "c")


#
# Fatal error in a, line 11
# c
#


==== Stack trace ============================================

Security context: 0x11330e857229 <JS Object>#0#
    1: foo(aka foo) [/home/mraleph/test.js:~1] (this=0)
    2: bar [/home/mraleph/test.js:2] (this=0x11330e857349 <JS Global Object>#1#)
    3: /* anonymous */ [/home/mraleph/test.js:3] (this=0xb6d64f79f11 <an Object>#2#,exports=0xb6d64f79f11 <an Object>#2#,require=0xb6d64f7c651 <JS Function require>#3#,module=0xb6d64f79e19 <a Module>#4#,__filename=0xb6d64f76a69 <String[38]: /home/mraleph/test.js>,__dirname=0xb6d64f7cfb1 <String[30]: /home/mraleph>)

/// and so forth
The cause in jsbin
I found a very detailed stacktrace in my logs (I'm currently using forever with jsbin in production).
My stacktrace started like this:
#
# Fatal error in a, line 11
# c
#


==== Stack trace ============================================

Security context: 0x21783c406b71 <JS Object>#0#
    1: new constructor(aka Token) [/WWW/jsbin/node_modules/stylus/lib/token.js:~22] (this=0x1bf223f440d1 <a Token>#1#,type=0x2cb2b9cfbc39 <String[3]: eos>,val=0x21783c404121 <undefined>)
    2: arguments adaptor frame: 1->2
    4: eos [/WWW/jsbin/node_modules/stylus/lib/lexer.js:216] (this=0x1bdbdd256941 <a Lexer>#2#)
    5: advance [/WWW/jsbin/node_modules/stylus/lib/lexer.js:~155] (this=0x1bdbdd256941 <a Lexer>#2#)
...and as I suspected it was linked to a processor (stylus in this case).
As I scroll further through the stacktrace I also found the "Key" heading which I was lucky to an entry like this:
str: 0x25b2767e3809 <String[22]\: h1{color:red;}\n\nblink{>
Then further down I found the SQL string which would lead me to the bin that could consistently reproduce the bug:
sql: 0x25b2767e6d29 <String[280]: UPDATE `sandbox` SET `css`='h1{color:red;}\n\nblink{', `settings`='{\"processors\":{\"css\":\"stylus\"}}', `created`='2013-09-11T09:27:12.613Z' WHERE `url`='aHOVoMe' AND `revision`='2' AND `streaming_key`='8c47219c1d3f1e25c368fa82687b00f2' AND `streaming_key`!='' AND `active`='y'>
So I knew ow that the processor was Stylus and the CSS panel would crash when it contained, quite simply:
blink {
So I've patched jsbin by removing Stylus support (which appears wasn't particularly popular anyway) and I'll fix properly by creating a daemon process to handle the processors (and add SASS support along the way).
Though an interesting lesson is how to discover the super tricky bugs in node.