January 27th I got an email notification saying that JS Bin had become unavailable. Then next day real life human beings were asking what's going on. By 11pm on the 30th the last of the issues were resolved.
Earlier today Jake asked me: what went wrong?
Fucking, everything.
TL;DR
I get it, this is a big wordy blog post. I got carried away and enjoyed telling the story.
The short version is: CloudFlare, probably best to upgrade everything to latest software (which I couldn't do), 520 status can actually be a mismatched TLS exchange between CloudFlare and the origin. Oh, and don't lean on LLMs too hard when the shit is really hitting the fan - try to take a big step back and make sure you take stock.
Otherwise, here's the too-long, do-read version -
On being in maintenance mode
For the last 5 ish/maybe quite a few years or more, JS Bin has run in a fairly automated maintenance mode. There's usually little flurries of wobbles that need my attention every 3/6 months. JS Bin is coming on to 18 years old, which is geriatric by web standards.
Typically it's dodgy content on the site that I need to put banning in place, sometimes it's take down requests that come through from Amazon (where JS Bin is hosted), sometimes it's a memory exception that takes me a little longer to recover from.
You can see from the last 11 years of status checks, there's been outages but nothing quite like what happened this time around (ignoring that big one on the far left…):
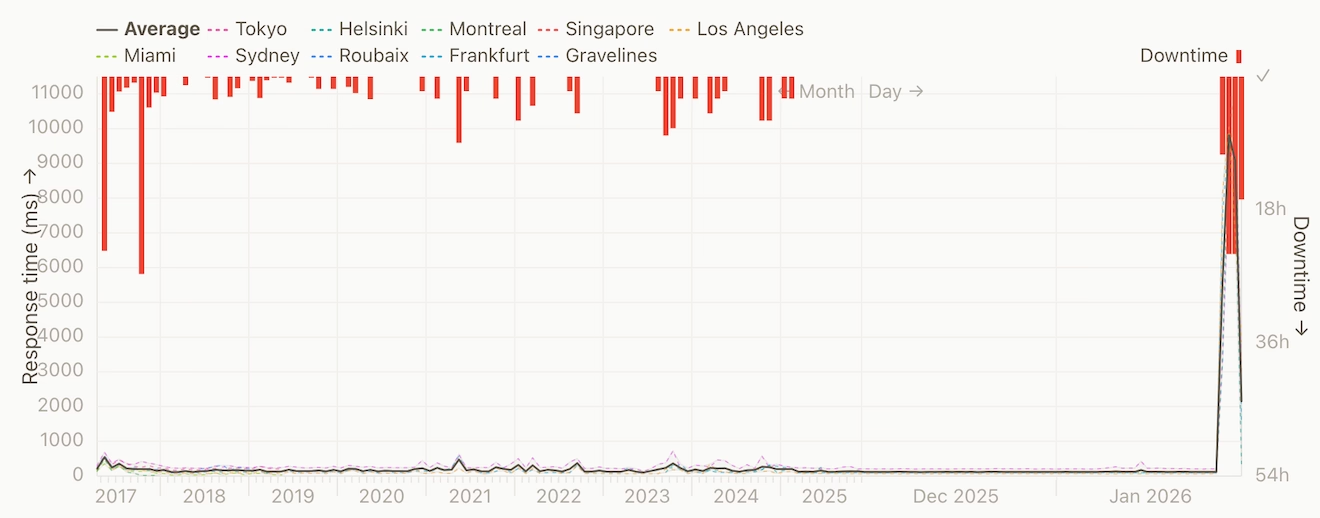
The larger hours when the server goes down (as I found out recently) is memory running out on the machine, and the machine will respond by pretty much collapsing. The result of which is that I can't connect to the machine via ssh to attempt restore it. It usually requires a forced reboot via the AWS console.
Then there's the odd occasion that even reboots from the AWS console, a literal "turn it on and off again", doesn't fly…
It wouldn't come back from a reboot
This latest outage just wouldn't come back from a reboot. I would trigger the reboot and then wait on the console attempting to connect over SSH so I could get some eyes on the situation but even then I couldn't get it.
JS Bin was rebooting and immediately locking up. So this tells me there's some external pressure on the machine that is not easing up.
The only option I have to hand is to shutdown the machine entirely for an hour or so, to let whatever is clawing at the door to go away for a bit.
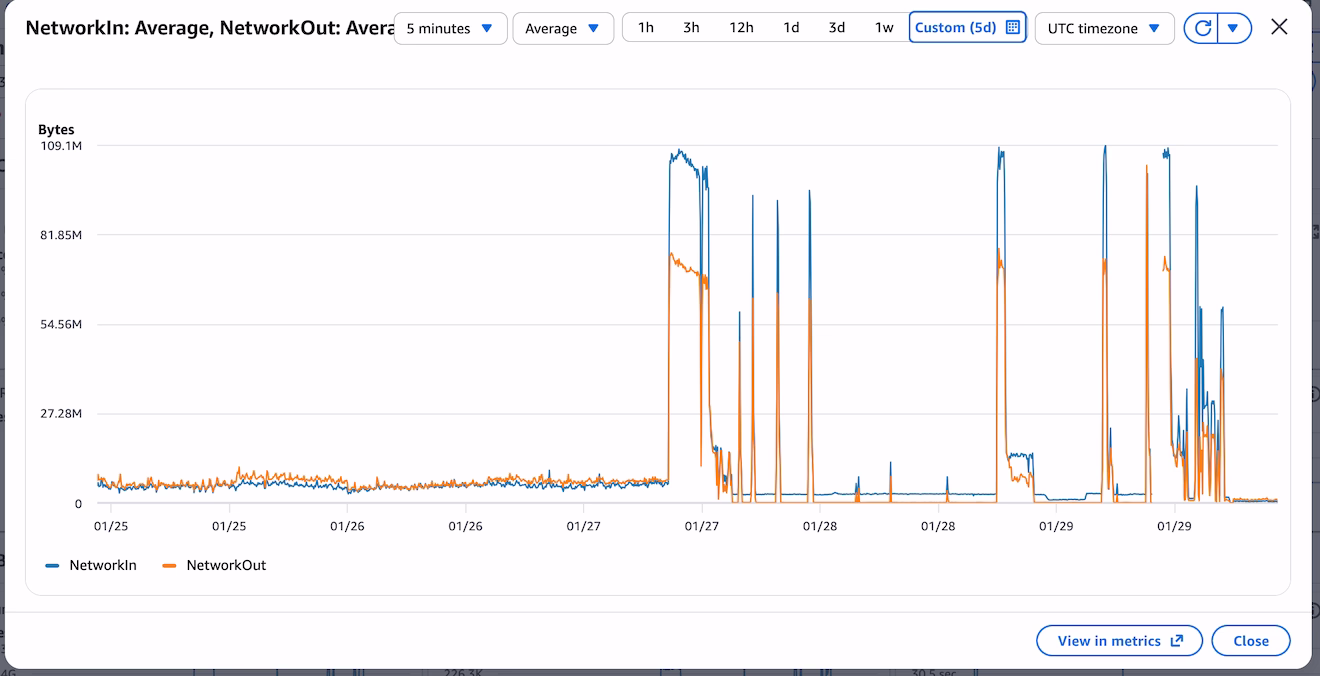
When I eventually looked at the Cloud Watch logs, it was clear there was something absolutely smashing at the walls (and door, yes, I mix my metaphors). The amount of inbound network traffic is unprecedented for jsbin. From the chart below, it shows normal usage in the days prior, a trickle of network inbound traffic by comparison to what I was now seeing.
The dips that happen after the cliff edge of monitoring is the machine giving up and being unresponsive. From the chart, I can see that even the short outage wasn't enough to get this beast off jsbin's back.
Killing the appropriate process
When I finally managed to get into the machine, the first stop was syslog to find out what was responsible for the crash (or rather the symptom, not the cause, not yet).
I quickly found the garbage collection dump and stacktrace of node running out of memory. First thing's first: let's kill the offending process rather than having a full shit-the-bed approach.
# /etc/sysctl.conf and reload with `sudo sysctl -p`
vm.oom_kill_allocating_task=1
That would mean node (which was saturating all the memory) would be killed rather than anything the system could get it's hands on - which usually meant I couldn't ssh into the machine.
This change wouldn't stop things getting sluggish on the machine but it would mean that I could continue to diagnose even whilst the traffic was bombarding the server (albeit with a very slow terminal responding).
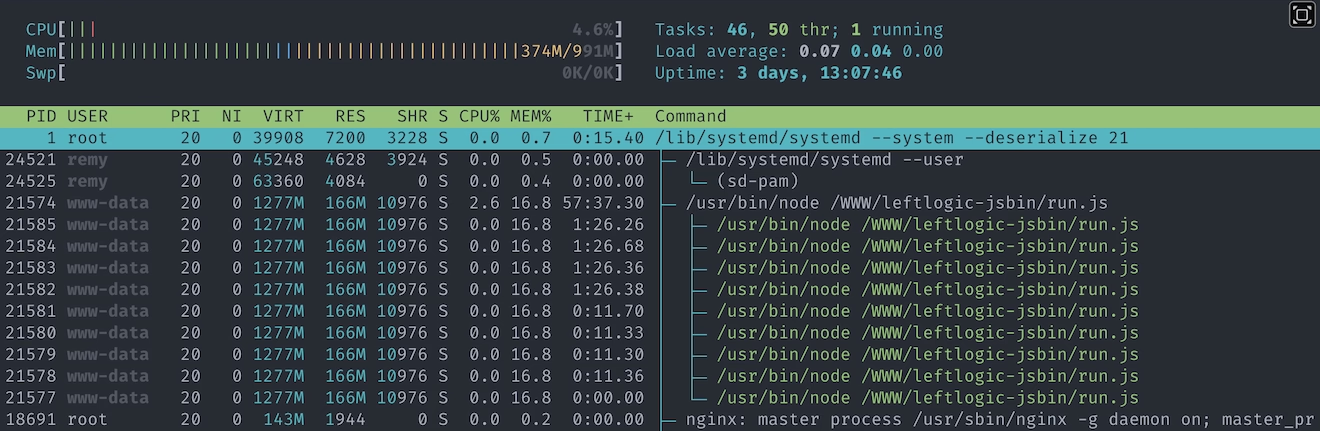
I could see the CPU usage was very, very high, and I could see node steadily increasing it's memory footprint (I use htop).
CPU usage of 100% is…okay because it means I'm using all the available process, but it leaves zero headroom and rather conspicuous that it wasn't dipping at any point.
Then chatgpt suggested upgrading node, which was weird because I'd never told Chatgpt what version of node I was running…
Side quest: node is really old
As with running in maintenance and things being in a status quo, I hadn't really touched node…at all.
As it happens, jsbin had been running on node 7 (not even "stable" node 8) for, I imagine, well over a decade.
To me, out of the blue, Chatgpt suggested I could upgrade node. This is a decent suggestion but at no point did I tell Chatgpt what version of node I was running.
On me querying, Chatgpt told me that I had told the AI which was a straight up lie.
After more prodding than I'd like, eventually it turned out that the version of node was in my terminal and at some point during the nginx tuning (in the next section), Chatgpt had helped itself to what was on the screen.
I've no idea if it has access to the scroll back history - I've got to assume it doesn't, but still pretty uncool.
I don't tend to use the "application" thing that Chatgpt has (I normally use the browser interface) but this definitely taught me a lesson: if there's sensitive data anywhere on the screen (ie. I had just cat an .env file) then it's entirely likely an LLM can see it too.
Anyway, I bumped from node 7 to node 22 and by some kind miracle it actually worked without any incident. It turned out that back in 2024 I had done some fairly significant work on the codebase so that I could run it on my local machine (which understandably didn't want to run node 7), so I had modernised the requisite parts.
Phew. At least the event loop is improved and going to be kinder on my CPU.
Except, it's still fucked and the adventure is far from over. Next I considered whether nginx (the proxy layer) could do with some optimisation.
Fine tuning on zip-all resources
Until now I've not shared what jsbin's main server runs on. It's a t2.micro AWS instance. Single CPU and 1GB of RAM. I'm often surprised it's managed so long on what I consider so little resources.
And yes, standing a beefier machine up (aka: throwing money at the problem) might help, but the time to reconfigure a new machine wasn't quick - I don't have an instant "build a new jsbin" script (remember, this server has been in maintenance for a long time and just happily running). It's also worth adding that although jsbin does has a "pro" offering, there's very little actual monetary resources. That's all to say: what can I do right now before creating a new machine (spoiler: I did make a new machine, and double-spoiler: it was terminated the following day as I didn't need it).
With the help of Chatgpt, Gemini and Claude (because somehow I have access to all of them, and I really don't have the full skills to know the ins and outs of nginx config) I looked at what could be tuned. I used multiple LLMs so that I could attempt to cross verify the advice (though I wasn't as diligent as I'd have liked).
The adjustments fell into these categories:
- workers spawned
- proxy timeout
- increase file descriptors
- keep alive timings
- remove http2 - to help with memory
Here's some of the actual config:
worker_connections 1024;
worker_processes auto;

keepalive_timeout 10;
keepalive_requests 100;
With the kicking I was getting from the inbound network traffic, this made little tangible difference. I'm sure it helps in the long run, but not when the machine is struggling with over 1000 requests a second and many more trying to squeeze in.
And then there was this:
Remy, have you considered CloudFlare?
I'd thought about add CloudFlare a few times in the past, but I was worried that the configuration adjustment and changes I'd need would be either complicated or would cause some other issue.
Except, nothing was working, so now was the time to get CloudFlare involved.
And so begin new problems…
Adding CloudFlare
Props where due, putting CloudFlare in front of JS Bin was relatively easy. CloudFlare detected most of the domains and where they pointed (the important ones at least) and it was a matter of swapping over the name servers from pointing to AWS's Route 53 to CloudFlare's own name servers.
Close to midnight on 29-Jan, I started to see jsbin.com load in the browser.
I thought there might be a few snags around, but quickly I got replies on github and via email that people were still (mostly) seeing errors.
In particular CloudFlare's 520 error page, which, as it turns out can be any number of issues.
Requests cutting through CloudFlare
Although I did have some success in loading, I could also see traffic still hammering through on the server.
With some help from our LLM overlords (i.e. I would have google'd it…"kagied it"?), I got the list of IP ranges that meant the traffic was from CloudFlare.
There was still a lot of traffic that didn't match those IP ranges. So the next step was to drop non-CloudFlare traffic.
This is where using the LLM cost me time via newly introduced problems (which wouldn't surface until the next day). I think I was too buried in the thick of things otherwise I might have caught it earlier (and not at the end of the process).
The first method to blocking non-CloudFlare was to use an nginx rule and variable, and to drop all traffic that wasn't tagged.
This would mean adding this line to each server {} block - this would say "If the request doesn't have the CloudFlare header, then don't let it through":
if ($http_cf_ray = "") {
    return 444;
}
Importantly there was more config directions that I followed (which I've tucked away, but you can read if you want), specifically set_real_ip_from 173.245.48.0/20; - this would trip me up later on.
The http_cf_ray config
Via Captain GPT:
The correct nginx-level approach (safe + reversible)
1. Tell nginx which IPs belong to Cloudflare
Create a file:
/etc/nginx/cloudflare.conf
Put exactly this in it (current CF IPv4 ranges):
set_real_ip_from 173.245.48.0/20;
set_real_ip_from 103.21.244.0/22;
set_real_ip_from 103.22.200.0/22;
set_real_ip_from 103.31.4.0/22;
set_real_ip_from 141.101.64.0/18;
set_real_ip_from 108.162.192.0/18;
set_real_ip_from 190.93.240.0/20;
set_real_ip_from 188.114.96.0/20;
set_real_ip_from 197.234.240.0/22;
set_real_ip_from 198.41.128.0/17;
set_real_ip_from 162.158.0.0/15;
set_real_ip_from 104.16.0.0/13;
set_real_ip_from 104.24.0.0/14;
set_real_ip_from 172.64.0.0/13;
set_real_ip_from 131.0.72.0/22;

real_ip_header CF-Connecting-IP;
real_ip_recursive on;
Include it near the top of http {}:
http {
    include /etc/nginx/cloudflare.conf;
    ...
}
This ensures $remote_addr becomes the real client IP, not Cloudflare.
2. Block non-Cloudflare traffic (this is the key)
In each public server {} block (ports 80 and 443), add this at the very top:
if ($http_cf_ray = "") {
    return 444;
}
What this does:
- Cloudflare always sends CF-Ray
- Direct clients never do
- 444 silently drops the connection (no response, no load)
This is extremely effective.
This config was all well and good, but traffic was still coming in. This change would mean that nginx would have to process the traffic than ignoring (or "dropping") it entirely (#foreshadowing).
When I ran command below, it would list the connections, and I could still see non-CloudFlare requests being able to complete request (at this specific point in time, I was in a frantic cycle of "try a change - fail - worry a bit - ask LLM - repeat"):
ss -tan state established '( sport = :443 )'
The next change that I put in place was to drop the request if the IP didn't match the ones in the CloudFlare IP range (whereas before the change was looking for a CloudFlare specific header). Looking back as I write this, I'm not sure why the header method didn't work, but I was sure to add more petrol onto the fire:
geo $is_cloudflare {
    default 0;

    173.245.48.0/20    1;
    103.21.244.0/22    1;
    # etc
}
This flags if the remote address is a CloudFlare IP, set the $is_cloudflare=1. Then in my server blocks:
server {
    listen 443 ssl http2 default_server;
    if ($is_cloudflare = 0) { return 444; }
    if ($cf_valid = 0) { return 444; }

    # rest of config unchanged
}
What I didn't realise at this point, and took another 24 hours to figure out, is that the first CloudFlare nginx based change would say "if the IP is CloudFlare, then set the $remote_addr to the original request". Then this code says "if the IP is NOT CloudFlare don't let them through".
It's a mess. Now I've got reports from people on github telling me they're still seeing mostly 520 errors, and finally I realise I can replicate by using a VPN because for some reason it was still working for me.
There's two problems at this point:
- Traffic still coming in that isn't through CloudFlare that's causing a drain on resources
- Real users coming through CloudFlare are, mostly, not getting the site
Pretty much the worst of both worlds.
Finally, firewall rules spring to mind. Better late than never.
Dropping traffic
This was done on two fronts - just for belt-and-braces approach:
ufw(or as I knew it "iptables") rules one the server toDROPorALLOWtraffic based on IP range- AWS security policy to do the same.
Running the rules for ufw was relatively simple. A matter of allowing all the known IP ranges, then denying everything else:
$ ufw allow from 173.245.48.0/20 to any port 443
$ ufw allow from 103.21.244.0/22 to any port 443
$ # etc
$ ufw deny 443
Then repeated for port 80. I did get tripped up during testing when I wanted to allow my IP through, but that was solved with ufw status numbered and then ufw delete N.
Adding all the IP ranges on AWS was not so simple. The web UI just doesn't allow for large changes - it's very, very clunky.
Thankfully I could automate some of it from the command line and script the work. The annoying thing was that the AWS command line doesn't let me bulk modify (or at least I didn't find it) and each command takes a good few seconds to run and requires me to press enter after the response comes back saying it had worked.
This was the command:
for CIDR in \
   103.21.244.0/22 \
   103.22.200.0/22 \
   103.31.4.0/22 \
   # etc
do
   aws ec2 authorize-security-group-ingress --group-id $SG_ID --protocol tcp --port 80  --cidr $CIDR --region us-east-1
   aws ec2 authorize-security-group-ingress --group-id $SG_ID --protocol tcp --port 443 --cidr $CIDR --region us-east-1
done
With those in place, finally the server was breathing again. However, those pesky CloudFlare 520s were still preventing people from visiting jsbin.com (except me…somehow…).
CloudFlare's 520
I naively thought 520 was like a 503 (the entire server is failing to respond to CloudFlare) or a 504 (gateway timeout - usually when node doesn't come back to nginx or CloudFlare), but it's not. It's more like "CloudFlare made a request and the response is incompatible".
The only real clue I had was that port 80, plain http wasn't affected. A helpful comment from @robobuljan showed that it was only the https version causing issues:
$ curl jsbin.com             # (works!)
$ curl http://jsbin.com      # (works!)
$ curl https://jsbin.com     # "error code: 520"
Although this digging took most of the day, it was the part that the LLMs really couldn't help with (and I had thankfully set them aside whilst I chewed on the meat of this problem).
As I looked for any clues. In the CloudFlare SSL/TLS page a section called "Traffic Served Over TLS" showed that there was a split in the supported TLS versions (I didn't capture a screenshot, but these numbers are from their API):
- TLSv1: 36 requests
- TLSv1.1: 56 requests
- TLSv1.2: 1,922,523 requests
- TLSv1.3: 5,216,795 requests
That's a lot on TLSv1.3, but I wondered how old (or actually new) v1.3 was given how old my rickety machine was. So I went back to my nginx config and found this line, repeated against each server block that ran SSL:
ssl_protocols TLSv1 TLSv1.1 TLSv1.2;
A conspicuous lack of TLSv1.3, and I wondered what would happen if the user asked for 1.3, CloudFlare tottered off wanting 1.3 and then got back 1.2… or perhaps nothing at all.
I first tried to add TLSv1.3 to the list only for the nginx -t test to fail (the module wasn't installed and I couldn't get it without doing major upgrade work). So let's see if it can be turned off in CloudFlare.
The short answer is yes, but I struggled to find it.
The first place to confirm what's being support is the section under "Speed, Settings". But to completely turn it off, it's located in "SSL/TLS" then "Edge Certificates" and towards the end of the page.
Disabling this unlocked a lot more genuine traffic and we were cooking again. Almost, nearly. Again, for some, now the static assets weren't loading nor was the frame that actually live runs the authored code (the null.jsbin.com domain).
JS Bin was dropping some users
It took me a few more hours to solve this last step, and I'm still not entirely sure how it all hung together. But if you recall, earlier in my nginx config, I had told nginx that if the IP of the request was from CloudFlare that we should use set_real_ip_from.
This specific command was writing the original IP of the requesting user into the $remote_addr, which is what nginx was now using to drop requests with the return 444. Somehow this wasn't in the main server block (the part that returns the index page), but was somehow in the static.jsbin.com and null.jsbin.com.
This kind of confusion is the result of working late hours, and working in crisis mode. I should have known better and I'm great at dolling out advice but sometimes don't tend to heed it myself.
After I finally removed the janky checks, IP swapping and quite a bit of the cruft that I had introduced with my pal ChatGPT, this let the last of the traffic come through correctly.
JS Bin was back. Entirely.
The aftermath
Now that CloudFlare is in front of the server, life is surprisingly chill on this 1GB single CPU machine. Way more calm than a normal day of traffic. Look at that CPU usage!
I suspect if I hadn't leant on the LLMs so much during the scream-face-the-server-is-down moments, I might have caught the complexity that I was adding. Though equally I should have put CloudFlare in front of JS Bin years ago - and not at a time of crisis.
I definitely learnt a few gotchas, the TLS and 520 status codes are that for me.
The traffic has eased out from the AWS CloudWatch logs and I believe CloudFlare is now bouncing a lot of that away from me - and it seems like a lot of that is coming from Hong Kong (which I've set to have a JavaScript based check to get through CloudFlare):
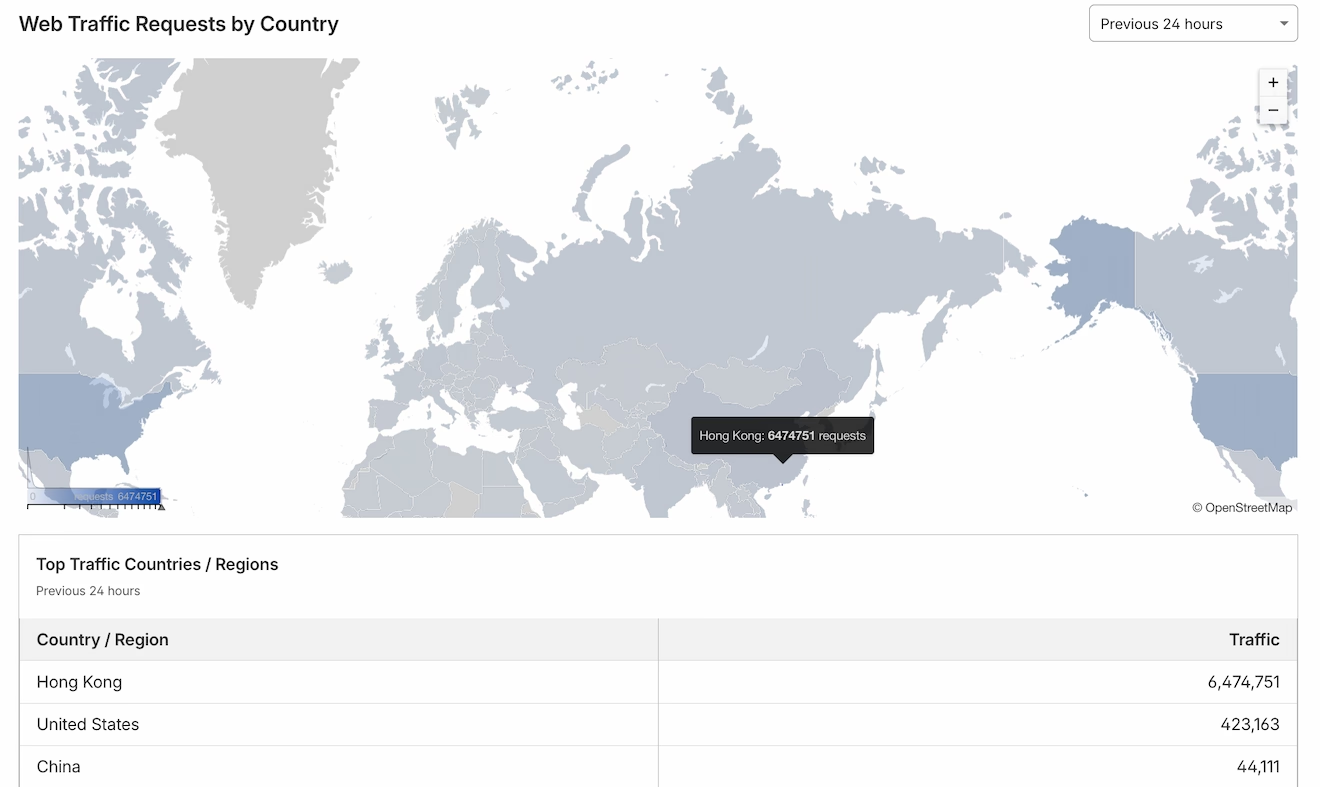
Since I took that screenshot, Hong Kong has 10 million requests in the last 24 hours.
Even though I don't think I'll ever really know what caused the amount of traffic that caused everything to fall over, my gut suspects scrapers for AI and LLMs just slurping up as much of the web it can. The only evidence I have against that theory is that the traffic didn't come from a single IP.
Whereas, weirdly, I saw a single IP bot scraping this blog, accounting for over 3GB of data and over 325,000 requests in a matter of hours. Thankfully this was running on Netlify and is entirely static, and not running on node 7 🤦.