I've written recently about my test strategy, fixtures and how I'm using tap. In this post, I wanted to show how I go further with the tests and get right into the code to debug in real-time.

MY EBOOK£5 for Working the Command Line
Gain command-line shortcuts and processing techniques, install new tools and diagnose problems, and fully customize your terminal for a better, more powerful workflow.
£5 to own it today
Specifically I've been trying to get my workflow into the state where I will first write a failing test, then code against that test until the bug or feature is implemented.
I've got this working to a tee with bugs, but features I still tend to write first, and then debug with tests. This post specifically highlights how I'll move from a failing test to understanding exactly why it's failing and how I'll quickly move to step debugging to solve the problem.
The workflow
I recorded a screencast of my workflow below, but will also detail some of the tools I'm using as they're all useful in isolation.
The tools
There's a number of different tools I use in the workflow video, some of which I've written about before, and others have been included as titbits.
Tap
I'm using tap for my test and runner, using the default runner. I always include basic coverage report during my tests using npm scripts.
"scripts": {
  "test": "tap test/**/*.test.js --cov"
}
In this particular project, I have sub-directories in my test directory, so the file match uses test/**/..., and I always name my test scripts as <name>.test.js.
Tap on the CLI
Often when I'm testing in isolation, I'll run tap directly against the test script I'm working on. This means that I have tap both installed locally and globally.
Quite often when I test a project from the CLI the local version of tap could be different from my global version. So I have a little trick in my shell (a bash function in ~/.bashrc) which will detect if there's a local version of tap, and if so, it'll run that version:
tap () {
  # find the real path to tap. if we had a decent version of which,
  # on the mac, we don't, we could use `which --skip-functions tap`.
  local TAP=$(type -p tap | awk '{ print $3 }')
  if [ -e $PWD/node_modules/.bin/tap ]
  then
    local TAP="$PWD/node_modules/.bin/tap"
  fi
  $TAP $@
}
.only
Tap doesn't come with a .only function, so I make use of a small package called tap-only which uses tap as a peer dependency. This helps me focus down my debugging to the specific test that's causing the failure.
Coverage
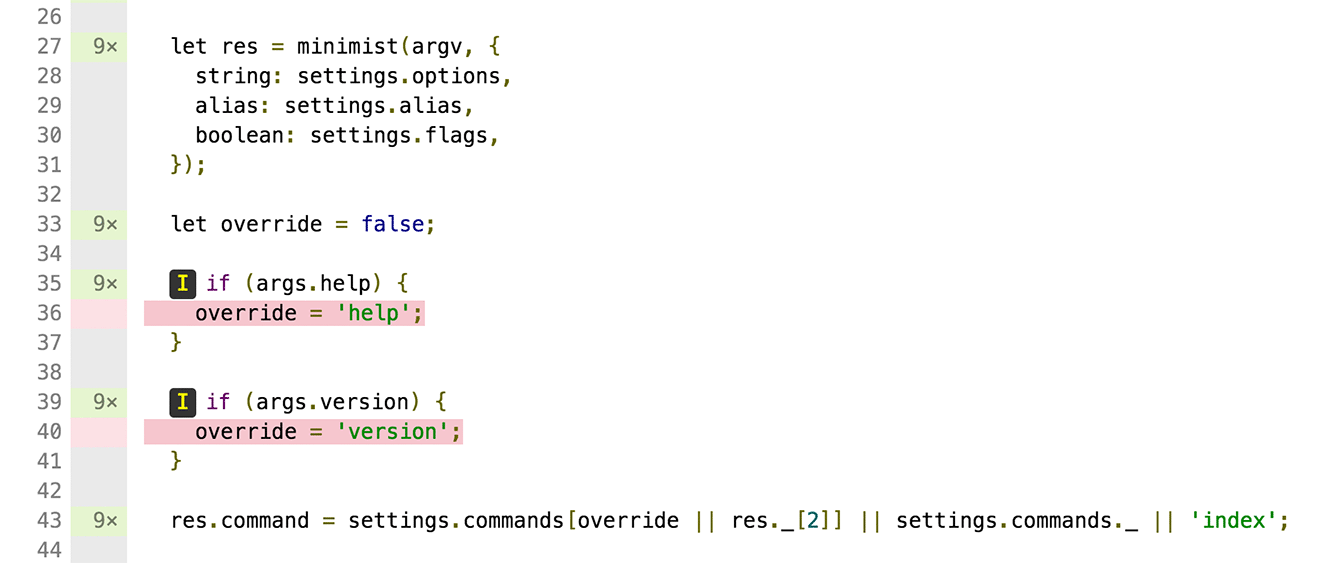
More recently I've been able to add coverage to my projects and I'm using it both to highlight where I'm missing unit tests or integration tests. In this example, I could see that I was missing coverage for the override logic:

This is generated using my npm run cover script through tap which includes istanbul support built in:
"scripts": {
  "cover": "tap test/**/*.test.js --cov --coverage-report=lcov"
}
From there I can target my test and start debugging the specific failure with the devtool utility.
devtool
Finally, I'll swap out my tap command for devtool (previously installed via npm i -g devtool as a global utility) which will fire up Chrome's devtool environment but connected up to my node session.

Currently I'll drop a debugger command and then run devtool <test>.test.js to run the tool and let it break as soon as it encounters my breakpoint. From there I can change the code (in my local text editor) and hit cmd+r to reload devtool.
I've used node-inspector and iron-node in the past, but I'm having a lot of success with devtool as part of my workflow.
The one thing that's missing is workspaces, but sadly there's an outstanding issue on the Electron (the shell) that's blocking this functionality landing.
It continues to evolve
As I continue to develop and slowly move with the times, my workflow is evolving and solidifying into something that I consider more and more stable. I do see some blind spots (automated client side testing, how Babel might mix into things and a more) but I'm pretty happy with the workflow right now and it's working very well for bug fixes.