I recently wrote about my node test strategy and in particular talked about using tape as my test runner and piping to tap-spec.
I've since started to migrate across to tap exclusively for both the runner and the reporter.
There's a couple of benefits to my workflow in using tap for the tests. Partly the reduced dependencies (so less tracking for changes and less knowledge required), but also the reporting is much more valuable to me, as I'll show you below.
Tracing errors
Below is the output, with an error inside my tested code whilst using tape as my runner and executing through tap:
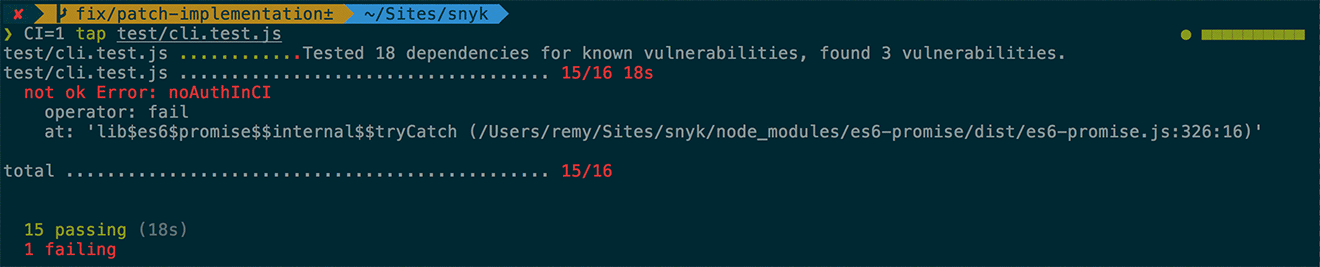
As you can see from the output above, there's an exception and it's failing the test, but there's very little information about where it failed. I can see it was inside a promise, but since a lot of my code is based around promises, including the test itself, there's essentially no stacktrace at all.
To switch my code from using the tape library to tap, I only need to change the require line from:
var test = require('tape');
...to...
var test = require('tap').test;
The rest of my test code can remain the same, as the API for tape is generally a subset of tap's own assert API. The output now changes to give a better idea of the stacktrace:
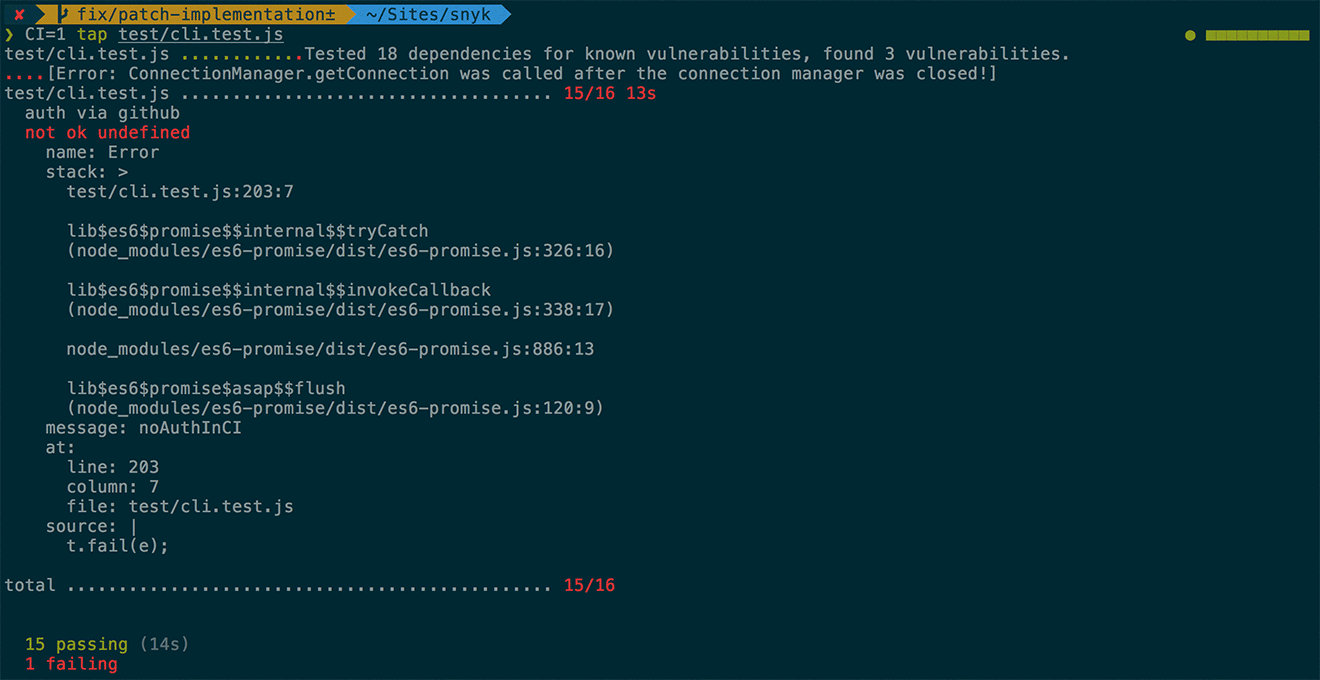
But this still doesn't quite give me enough detail. I can see exactly where the error is being thrown, but this is in my test code. I need to hook in the stack into my test. The following code shows how the error was being displayed (from the screenshot above):
auth().then(function (res) {
  t.notEqual(res, -1, 'auth worked');
}).catch(function (e) {
  t.fail(e);
});
Instead of using t.fail and passing the error directly in, I switch to using t.threw which works nicely with my promise code and will give me a full stacktrace. A side benefit is that I can also avoid using a planso long as my promise has a final .then(t.end) to notify that the tests are complete:
auth().then(function (res) {
  t.notEqual(res, -1, 'auth worked');
}).catch(t.threw).then(t.end);
Now the failing test has much more detail:
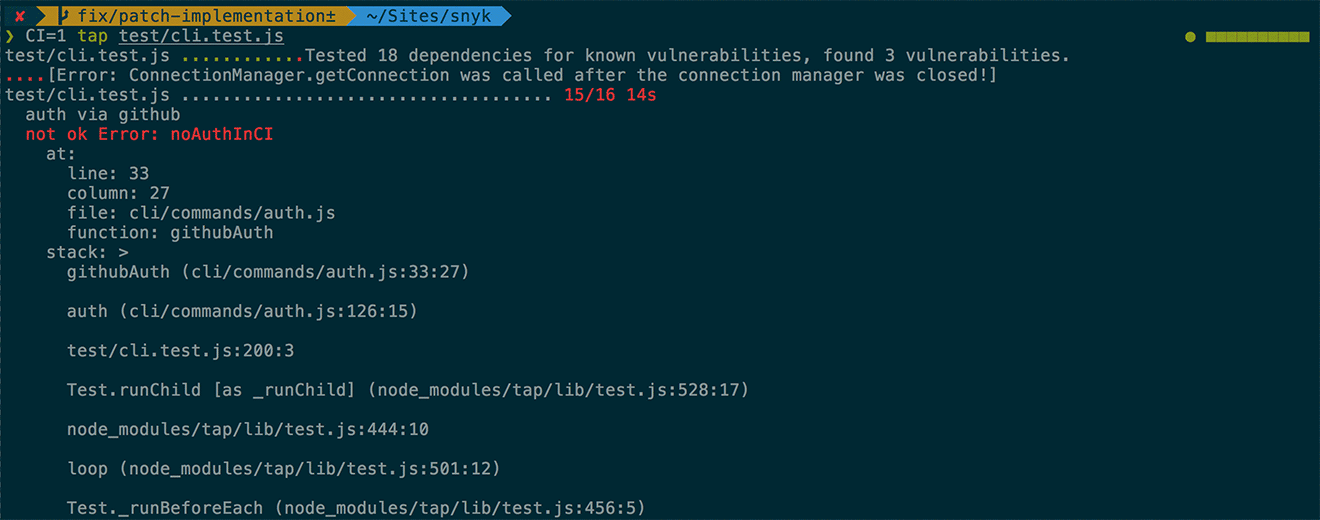
I have the full stacktrace from the origin of the error and I can fix the issue.
Visual deltas
Finally it's also worth showing the other big benefit to me, specifically around failing deepEqual tests. In some of my integration tests, I'll create a fixture that's a JSON object the expected result.
If there's an error and the result is different to my fixture, the tape result doesn't always help understand where the issue is. As you can see below, the object has been dumped out without any real clue as to where the issue is:
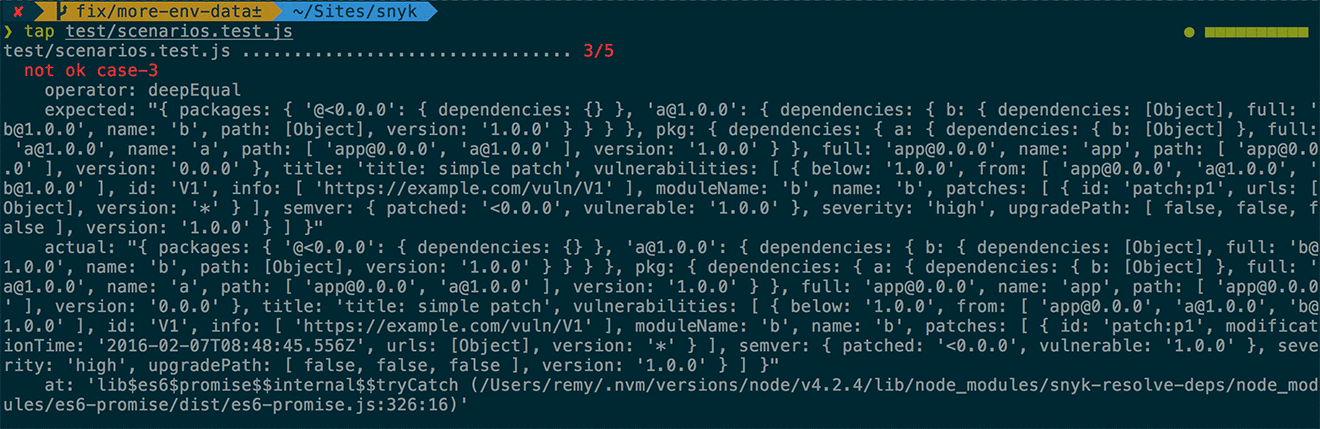
However, using tap as my required test library, automatically gives me a visual cue on the delta between my fixture and my actual output:
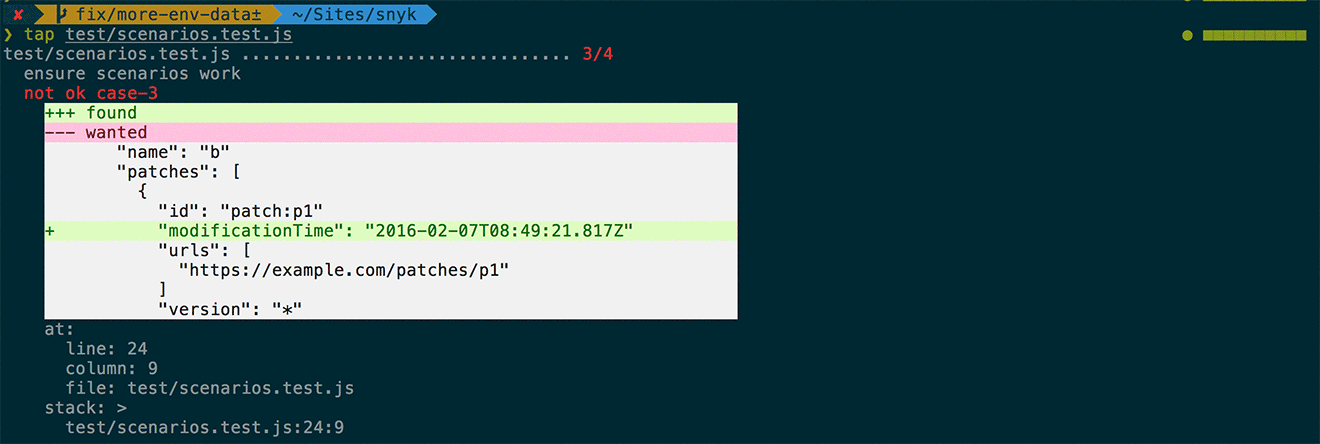
Immediately, I can see the timestamp is the problem and it's simple for me to then go and either fix the code or change the test.
Coverage reporting for free
Finally, tap comes with coverage reporting built in. For local testing, I include the following in my package.json so I can browse the interactive coverage report:
"scripts": {
  "cover": "tap test/*.test.js --cov --coverage-report=lcov",
This generates the istanbul coverage report that I open up immediately and see either where I'm missing coverage, or where I can identify dead code.
In addition, since I publish to Travis for my tests, it will post automatically to tools like coveralls.io and I'm able to share the coverage either with the public or with my team internally. Note there's a few specific environment values you need to get coverage working (specific to Coveralls):
- Add your coveralls token under
COVERALLS_REPO_TOKEN - If you've got a private repo, use
COVERALLS_SERVICE_NAME=travis-pro(you don't need this for public repos) - If you're using more than one test in your test matrix (i.e. testing node 0.10, 4 and 5) include
COVERALLS_PARALLEL=true
One important caveat: when you include coverage in your tests, then the stacktraces will often only show the right filename and function name, but not the right line number. This is because the coverage has instrumented the code (though I'd expect sourcemaps could solve this issue). If I have a failing stacktrace, I run the tap CLI command directly against the failing test file.
And that's it. These are the reasons I'm using tap now over tape, and so far, it's all proving really valuable. My next post on testing, I'll explain how I debug and fix failing tests in (as close to) real-time as possible.