I've recently released a number of changes to JS Bin after I started to tinker (again) with Service Worker support in JS Bin (no, there's nothing there right now). However, since the release on Saturday, the CPU has been steadily sitting at 95% - which is dangerously close to the 502-o-death page.
Except, if I'm honest with myself, the CPU has been high since...well, since I can remember (going further back into 2013).
Until this afternoon. I made one change, and boom: 20%. Stable. Also, I'll be filling this under "duh".
Solution
Although JS Bin's code would load a config file and set the NODE_ENV dynamically. Except...it wasn't actually being set early enough.
I changed the upstart script to execute directly in production mode, and voilà, the CPU dropped to a nice stable 20% (or so, rising and falling as I'd expect).
The how
The obvious thing was that the CPU was running very hot and consistently. JS Bin has a lot of traffic, but when the CPU is that high, it's usually going to die rather soon. As I had released some changes at the weekend, I knew that it was potentially a problem in the new code - the problem was also that JS Bin has run around the 70-90% mark for many, many months.
Instrumentation
The code would need instrumentation, so I looked at some tools to see if I could get some insights into what was going wrong. I used to have a (free) nodetime account but that wouldn't let me in because I had somehow run more than one application with the API key.
I tried out New Relic, which after first was pretty awesome, amazing charts, very pretty (though didn't lead me to anything obvious) - but something seemed wrong in the JS Bin process. The memory footprint was going up pretty steadily to capacity. Soon enough the process topped out and I removed the New Relic code. It turns out there's a memory leak that's being addressed, but it's not solved at the core (since it's a node problem rather than New Relic).
StrongLoop was next, but once I got the CLI tool installed (after some issues), I couldn't work out how to connect to the client using the web interface...at all. Another abandon.
Keymetrics was also suggested (which, I believe, is produced by the makers of PM2 a Process Management tool for node) - but it didn't look like it could do instrumentation, so I didn't proceed.
In the end though, and randomly, my nodetime account started working..!
The problem was: I've never really been able to read the nodetime data to make head nor tail of it...
Clues
Heading straight for the transaction profiler, I started watching the operations. The transactions refer to routes being hit, as since there's so much varied traffic, it doesn't really give any clues as to what's slow (unless there's a specific bin causing the problem). But there it was, clear as day:
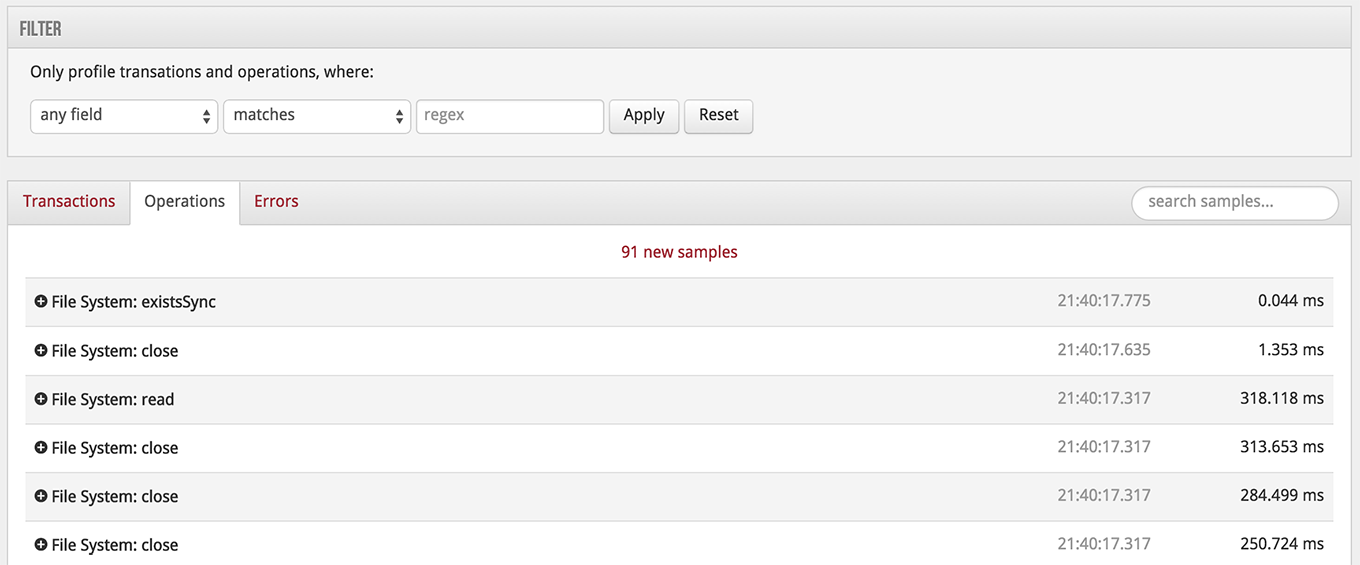
All that file IO shouldn't be happening. When looked closer, I could see the readFiles were all around my view directories. My templates. I had switched from hbs to express-hbs but it seemed weird that it wouldn't use pre-compiled templates in production mode.
I did some digging, of course there's no mention of switching to compiled templates in production mode in either npm modules (pre-compiled templates would mean it wouldn't read from disc to constantly be serving files).
Realising this, I figured my process must think it was in a development mode, and immediately updated my upstart script to run JS Bin with NODE_ENV=production.
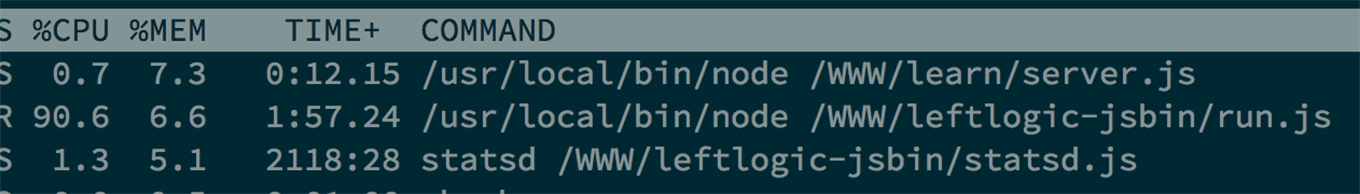
The result was going from this (note run.js CPU):
To this:
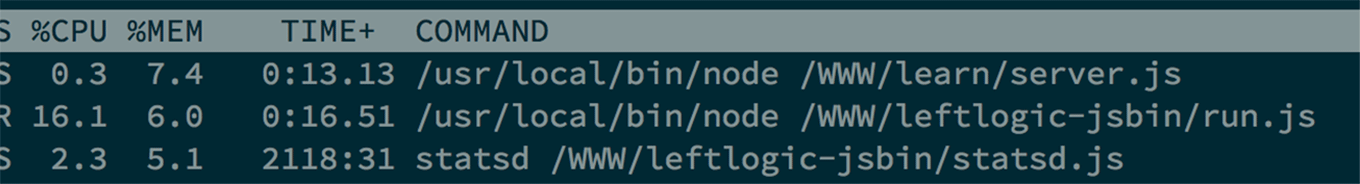
So, yeah. Filed under "duh".