At this time of year (Christmas) there's a lot of tip-like articles that emerge, so I wanted to share what I felt like was the single greatest technical win I have come across in the last few months: using Chrome DevTools for full web dev workflow - so I recorded a quick 4 minute screencast (and even wrote up a few extra bits - because I felt generous this Christmas!).
Actually, truth be told, it's not the entire workflow (I can't create new files for instance) - but where I'm up to is: navigating my entire project, making changes and seeing the live impact of that change, testing new ideas and most importantly - actually saving those changes to disk without leaving DevTools.
Although I'm using Canary in the screencast, this functionality is available today in Chrome stable.
Saving
For a long while now, you could edit the "sources" to the web page, and hitting save cmd-s and it would update the current state of the JavaScript engine - which is powerful as hell alone.
But in a recent release to DevTools, a feature that previous required an extension, when you save, DevTools will ask you where you want to save the file to. In my case, I'm working on client side apps - which means just a static directory of JavaScript files. That means I can overwrite the existing file (js or css), and when I continue hitting save, it now overwrites that file on disk.
For me, this seemingly simple addition, means I can do a large amount of coding, testing and debugging directly inside the browser - which reduces the workflow loops.
It's also worth adding that, whilst you haven't refreshed, you can also get a complete list of all the modifications - right click on the source: local modifications. From there you can see the time of edits but also see diffs of those changes and revert them (though I believe you should be able to revert individual changes - i.e. just the first change through a patch, I didn't have any success with this and suspect it's just a bug in Chrome that I came across).
Code with live state
Another big win for me (which I didn't include in the video) is that whilst I'm working inside the sources panel, and experiementing I can quickly and easily inspect the state of variables.
 I'll add a breakpoint, or a conditional breakpoint (right click on the line) - the code pauses, and hit
 esc to bring up a console and test code and check variable state or check entire lines of code to see if the result is what I'm expecting.
Space and stretching your legs
Finally, a couple of extra bits that make my workflow more comfortable for me. I always bump the font up on the DevTools (simple cmd-+) - maybe because I don't like to strain my eyes, maybe because I'm getting old!
I dock DevTools to the right (in most cases) - which used to be under settings (the bottom right cog) but in Canary has moved to click-hold the bottom left "popout" icon.
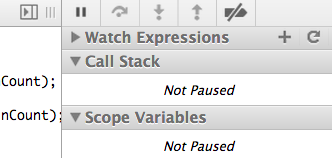
 Then lastly I tend to hide the source navigator (the list of files) and the debugger (the right hand side) using the little collapse icon.
What I'd like to see next
No doubt there's someone I can direct these to, but equally I wanted to share my thoughts here because either maybe you know they're coming, or there's other features you'd like to see too:
- Ability to edit the "program" file, including the HTML, CSS & JavaScript #167289
- A comment toggle keyboard shortcut (I keep hitting what I think it is, and instead pausing code execution) #167284
- Much clearer feedback when saving wasn't linked to a file on the hard disk (sometimes I've hit save and it'll save in V8's engine, but not actually to disk, because I hadn't linked it up yet) #167285
- Autocomplete whilst editing source (perhaps looking up from the autocomplete in the console) #167290
- Toggle word wrap on sources #167287
I'm sure there's more I'd like to see the more my workflow moves inside of DevTools. I certainly hope this is as useful to you as it was to me when I discovered "save as"!

MY EBOOK£5 for Working the Command Line
Gain command-line shortcuts and processing techniques, install new tools and diagnose problems, and fully customize your terminal for a better, more powerful workflow.
£5 to own it today