This is the accompanying article for my Art of Debugging talk that I first gave at Fronteers in Amsterdam in 2015.
TL;DR: learn every tool that's available to use, use them as you need them, enjoy bug bustin' - it's certainly more fun pounding the keyboard and working on a 6 month feature drive.

MY EBOOK£5 for Working the Command Line
Gain command-line shortcuts and processing techniques, install new tools and diagnose problems, and fully customize your terminal for a better, more powerful workflow.
£5 to own it today

Additional resources
But, before we start though...
How to skip to the end...
Don't.
Write.
Bugs.

Although...
Assuming you're not a robot, and you might have written a bug or two in your time, the truth is: there is no silver bullet.
And in fact, I lied a moment ago, "don't write bugs" is the exact opposite to learning to debug. You need experience. You have to encounter bugs to be able to recognise how to approach them.
There's no hard and fast skill you can acquire for debugging (or so I believe). It's acquired through time as you struggle through the first time you encounter something. Spending hours and hours trying to fix a problem, but the upshot: you won't spend hours and hours the next time around.
At the company I worked at 10 years ago, when new employees came on board, we would have them all excited about the job and the kinds of problems we were solving, but on the day of them joining, they would be assigned to bugs for 3 months. It kinda deflated their expectations, but we'd find that after those 3 months, they'd request to stay on bugs.
They had the chance to dabble in so many areas of the business whereas other developers were coding the same single feature for 3, 6 even 12 months, and even then, it would go live, have bugs, and our bug catcher would swoop in, fix the bug and get a slice of the glory.
Attaining that hands on experience, I believe, is key to both being a good developer, but really, knowing how to debug anything. The designer from that company 10 years ago, Chris - he was the CSS wiz. He knew all the answers when the server side devs would get stuck with simple things. I'd often find myself asking him why the layout had broken so badly in what I thought was a relatively simple design. His answer, quite often, was "add zoom: 1 to that element".
He had completed the debugging step in head and come to a reasonable proposal that this particular change could fix my issue, almost entirely because he had seen so many permutations of the visual bug that he could recognise by eye.
That's what I'll do in many cases of bugs I come across. I'll know the particular system well enough to allow myself a heads start to the solution.
But before I continue, I have two disclaimers...
Disclaimer #1 - frameworks
Before anyone gets all preachy, this is not the definitive way to debug on the web. There are many ways. This just happens to be what I know, and how I do it. If that helps you, super. If you do things differently, that's cool too.
I personally don't use frameworks and large (opinionated) libraries. Ember, Polymer, React, Anglular, etclib. I don't use them. I've not had a need for them in anything I've done, so I've not had the requirement to learn (and please don't take this as an invitation to teach me!).
What this means is the the specific tools I use may not be applicable to your workflow. In fact, it's entirely possible that it's not compatible with your workflow.
That problem is partly related to the complexity of the applications you're using (by "applications" I mean the supporting code to pull of the site you're trying to build). For instance, React has created it's own language to give developers maximum confusion impact in building apps, but because of this, the code it transpiles to is utterly useless to humans and is intended only for computers/browsers. So debugging it requires at the very least sourcemaps, but because (I can only assume) it also has it's own state management (and other fancy toys) you're encouraged to install the devtools extension to debug your React apps (I believe Ember is similar here too).
That doesn't mean this information is useless to you, I will touch on ideas that are important when debugging, I'm just saying: I don't use frameworks, so I don't debug with them either.
Disclaimer #2 - I rarely cross browser test
Yep. I said it. But before you throw me to the wolves, hear me out. I don't cross browser test because more often than not, my work requires that I write JavaScript. Vanilla JavaScript, not JavaScript that interacts with the DOM.
In my eyes, there's two types of JavaScript that I'm interested in: browser interactions and everything else.
Everything else has to work in ES5 (perhaps with bits of ES6 sprinkled on) but that's it. Unless I'm supporting IE8 (which recent projects I'm not), all my JavaScript will work across all browsers, because it's stuff like:
function magicNumber(a, b) {
  return Math.pow(a, b) * b / Math.PI;
}
It doesn't matter where the code above runs, if there's a bug, there's a bug in all the browsers. If there isn't a bug, there isn't a bug and that's that.
Also this doesn't mean my code isn't tested across other browsers. If possible and required, I'll run automated tests in different browser environments (using tools like Karma or Zuul - but the whole automated cross browser testing thing is yet to be really fixed, it's kind of a mess right now).
Again, this is entirely due to the nature of my work. I'll address later how (or even whether) I will cross browser test.
The Art of Debugging
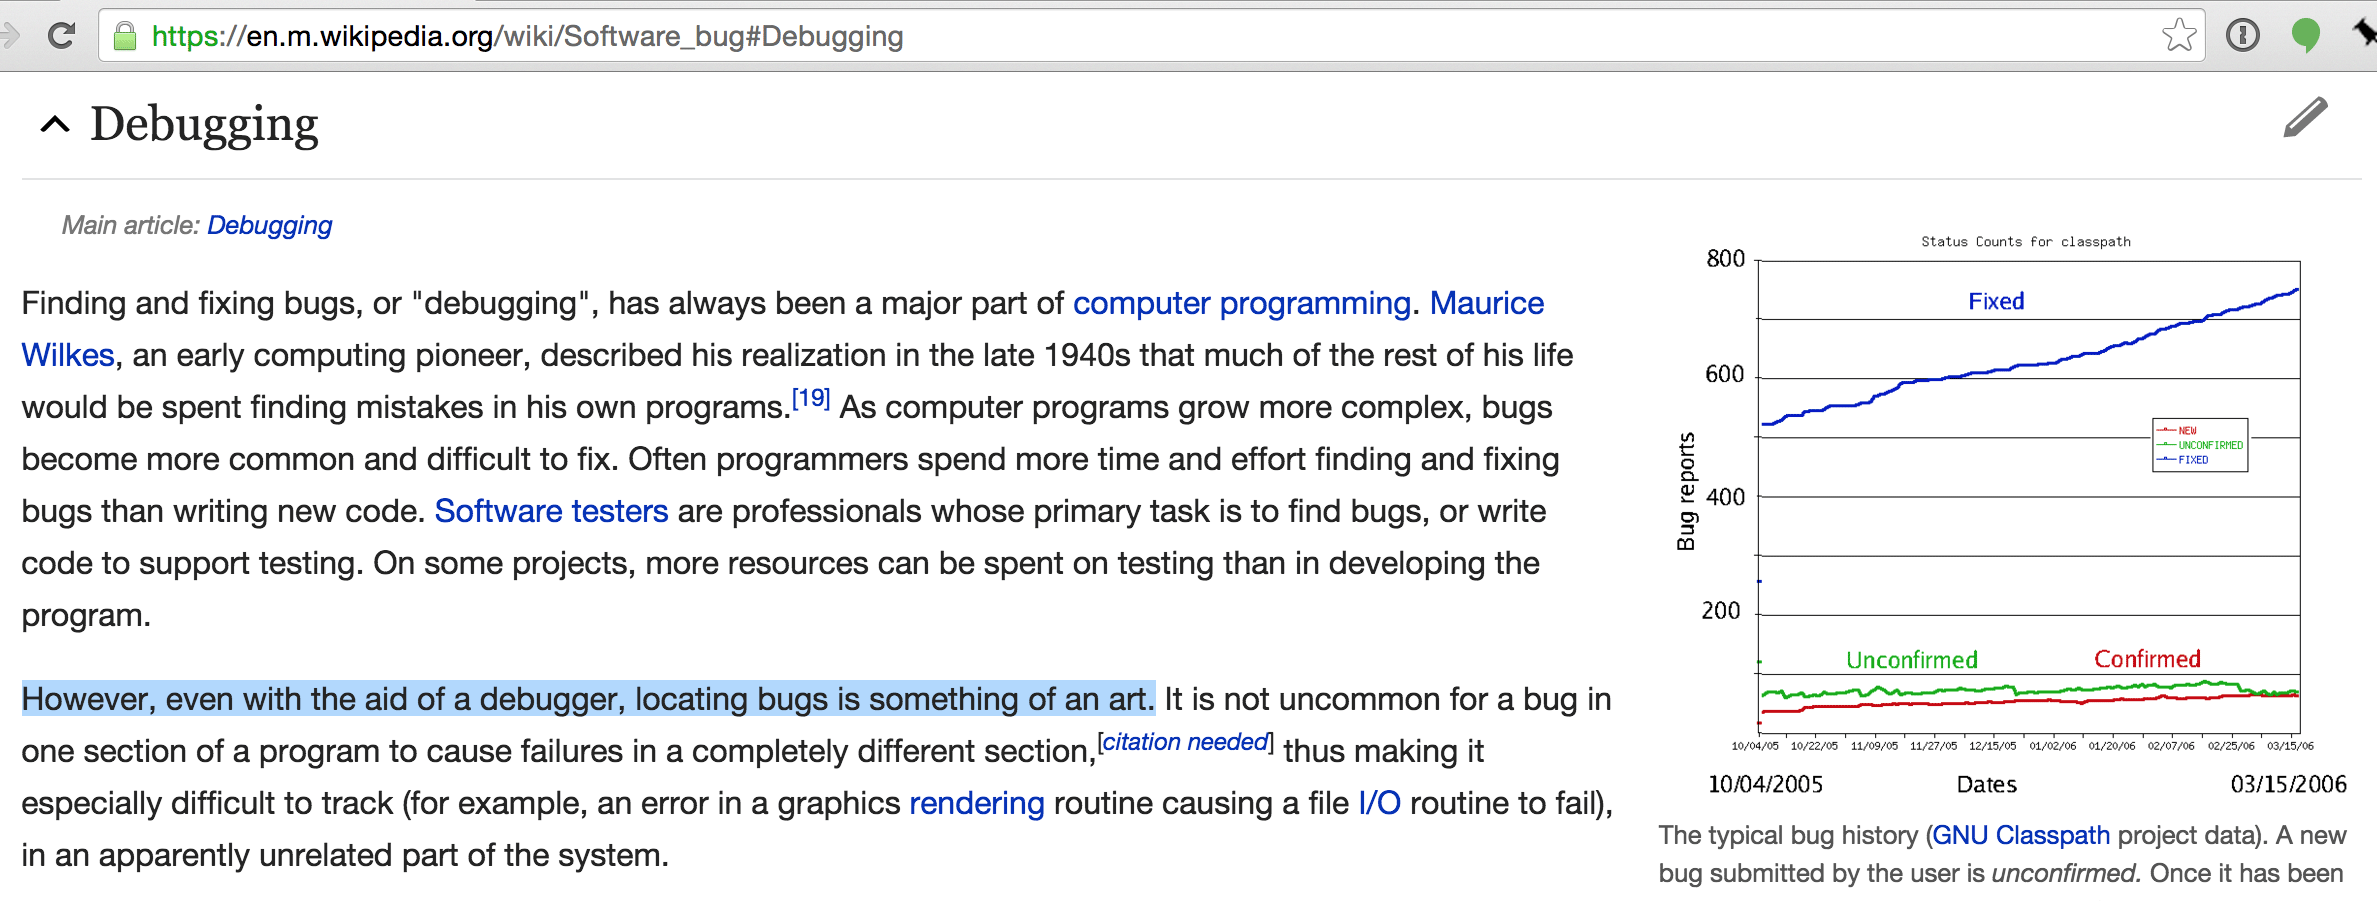
This is something I open with in all my debugging workshops, and look, even Wikipedia says it's an art, so it's a thing, okay!

I breakdown (in my head) debugging as the following:
- Replicate translation: see the bug
- Isolate translation: understand the bug
- Eliminate translation: fix the bug
Replicate
Replicating the bug is the hardest part of the entire job. More often than not you'll get a bug report along the lines of:
Saving doesn't work.
...and that's it.
Right, so not only do I have to be diplomatic in your response, as much as I want to respond with simply "yes it does" [close], but I also need to glean as much information as possible to be able to replicate what this user is seeing.
If the site they're talking about is jsbin, then I know saving does work, because I just used it, it just means that saving isn't working for them (and potentially others). Translation: saving could just be working for me.
If I visit a URL that the user is talking about, and it breaks immediately. That's a lucky break. This is the litmus test and it's always worth doing. Never jump right into trying to replicate 100% - take it step by step. However, it's also more likely is that there were a series of events that preceded the bug manifesting, and I'll have to understand what those were, and then repeat them myself.
Carefully, meticulously and systematically. This is important because I won't just do this once, I have to be able to do this over and over (or at the very least: twice).
There's some key tools that help me to replicate environments, or two at least help identify what parts of the environment I can rule out:
Privacy browsing mode / incognito
Incognito mode in Chrome (and known with other names in other browsers) lets me fire up the site without (most of) my browser extensions running. It'll also start with a clean slate with respect to cookies, offline storage and any other pre-baked configuration that my "normal" browsing sessions come with.
I can say for certain that I get at least one bug filed each year which is usually very strange and comes down to a rogue extensions on the user's browser that's interfering with the web site code.
By running in incognito, and seeing no bug, then asking the user to repeat the same task, I'm able to immediately confirm that there's an external entity at play (i.e. typically an extension).
Multiple profiles
In Chrome I have my personal profile. The one that lets me visit my email without always asking me to log in (though...maybe that's bad, but swiftly moving on).
I also have two other profiles:
- Anonymous - this user is totally clean, no extensions, no history
- Troll - this user will be like Anonymous, but also have cookies disabled, and security settings put on maximum
I don't often need to switch into these profiles (mostly because I'm able to replicate bugs earlier in my testing), but these are available to easily jump to.
The troll user is particularly useful, because it's very easy (for me) to forget that some users have higher security settings and the result is that APIs like localStorage will throw exceptions - which if are uncaught, could cause chaos.
Now that I'm able to replicate consistently, it's time to strip away as much as I can to reduce the noise and potential confusion before I'm able to fix.
Isolate
Isolation is about parring down the bug as far as I can. If an extension is the cause of the bug, let's disable one extension at a time until the bad one is found.
If it's a bug in a relatively complicated set of JavaScript requiring a lot of user interaction, I'll ask myself can I refactor this particular area of code out so that I can test it in isolation and inject pre-baked state?
I built jsbin.com for exactly this problem. To take a problem, strip it right down, and then either fix and share with whomever needs it.
Once it's stripped down as much as I want it to be, I'm on to fixing the bug.
Eliminate
This is actually easy once the replication side of things is taken care of. These days (2015) I'm more likely to actually create a failing test in my project that will replicate the bug that I'm working on, and then I'll fix against the failing test. The benefits should be obvious.
It's really quite simple at this state. The same way that the act of writing code is simple (once you can touch type). The hard part is in solving the problem, which doesn't happen by pressing keys on keyboard.
When you can't replicate...
Well...you're shit out of luck, and you can blind code a solution, but it's not debugging. You need to consider whether you've got a Heisenbug on your hands (yes, I like that word!). It's a bug that literally changes shape and form as you try to interrogate it.
I've personally encountered a few of these myself. The worst kinds (for me) are when these bugs only occur in my CI system (like Travis). The bug I was working on was fixed in my local environment, and I understood the code well enough to know the bug was fixed, but my tests wouldn't pass. The task now is different, the task was debug the test environment, which is a closed system when it's CI.
The other significant time I encountered this type of problem was back when I used Firebug (which stopped around 2009-2010). Firebug is/was an intrusive debugging tool that would inject content into the DOM to achieve the debugging. It also had bugs (as do devtools and all the other debuggers - see the start of this post!). It meant that there were certain edge cases that you could run into that would trigger bugs in the debugger making debugging extra...challenging.
The same is sort of true today. Recommendations for debugging with the devtools timeline is that you don't turn on all the recording checkboxes, and that you ideally close all other tabs and anything else that might be using WebKit (like Spotify...I'm assuming there's some overlapping OS access that WebKit and Blink have...). This is because all of these will affect the performance recording.
Debugging approaches
The tooling available splits into two categories:
- Inside out
- Outside in
I acknowledge these aren't good names. By inside out, I mean that the source of the bug is known. Usually a particular function or line of code, and a debugger statement can be added, a breakpoint or a conditional breakpoint (break when an expression is truthy).
Outside in is more interesting, in that you can identify that there's a bug visually, perhaps an element isn't behaving the way you would expect. There's a growing number of tools to help to take you from the visual problem and break into the code source of the problem, without particularly knowing the source code.
These tools include:
- DOM breakpoints - break on subtree modification, attribute modification or node removal
- Ajax breakpoints - break when an XHR call is executed
- Replaying XHR - allowing you to re-inject the response from the XHR call
- Timeline screenshots - both against the network (usually boot time) and on the timeline during runtime
My favourite/most used tools
Finally I want to share with you some of the workflow I use and some of the tools that I always find myself returning to.
Workspaces & real-time updates
With devtools open, and the sources panel selected, simply drag the local directory you want to create a workspace for onto the source panel, and devtools will ask for access which you will need to confirm.
This doesn't complete the step though. To let devtools know that a particular origin, like http://localhost:8000 is being served from your new workspace, you need to map at least one file. Right click a file from the origin list, and select "Map to file system resource", and select the local file it relates to.
Now whenever you make any changes, you will be able to save and it will save directly to disk. Why is this important? Now you can debug and commit directly to disk without switching contexts, without switch from your editor to your browser.
What is also really fun and powerful, is that if the CSS files were also mapped, any changes in the elements panel to styles, directly update the CSS file attached. This means I can make really tiny visual changes in the elements panel (where I'm used to making changes) and it'll already be saved for me to disk.
Undo
I've run a number of debugging workshops and the one consistent question that comes up after I show off workspaces is:
How do I revert the changes I've made in the elements panel
It would seem that developers are consistently much more fast-and-loose with the elements panel than compared with editing source code directly.
It's still a fair question. To that I reply:
- Source control!
- Undo
Chrome devtools has really good undo support. I can make a whole series of CSS changes, and then move on to JavaScript and then make changes to the DOM, and I can still go back and undo all the CSS changes I made.
I've noticed that I do have to be focused on the particular panel and source for the undo to work (which I suppose the undo history is associated with the panel), but it's really good.
Obviously when you reload, you lose the history. It's the same with Sublime Editor, if I unload and reload Sublime (i.e. restart the application) I'd expect the undo history to be lost.
Console shortcuts
$&$$- akin to jQuery's$function to query elements on the page$_- the result of the last expression$0- the currently selected DOM node in the elements panelcopy(...)- copy to the clipboard, and willJSON.stringifyobjects, but also get the outer HTML of DOM nodes,copy($0)is pretty common for me
Timeline screenshots
Really nice way to go back in time to see what in the application's boot (or interaction time) changed something on the page. I used this recently to fix two different problems.
The first was reviewing the boot up screenshots for jsbin.com, and seeing that the font was loading right at the end, but taking up a reasonable amount of time (WRT entire boot time). I could see this because the font would flash into place right towards the end of the document being ready. I was then able to use font loading techniques to make the font load via local storage and improved the perceived boot up time.
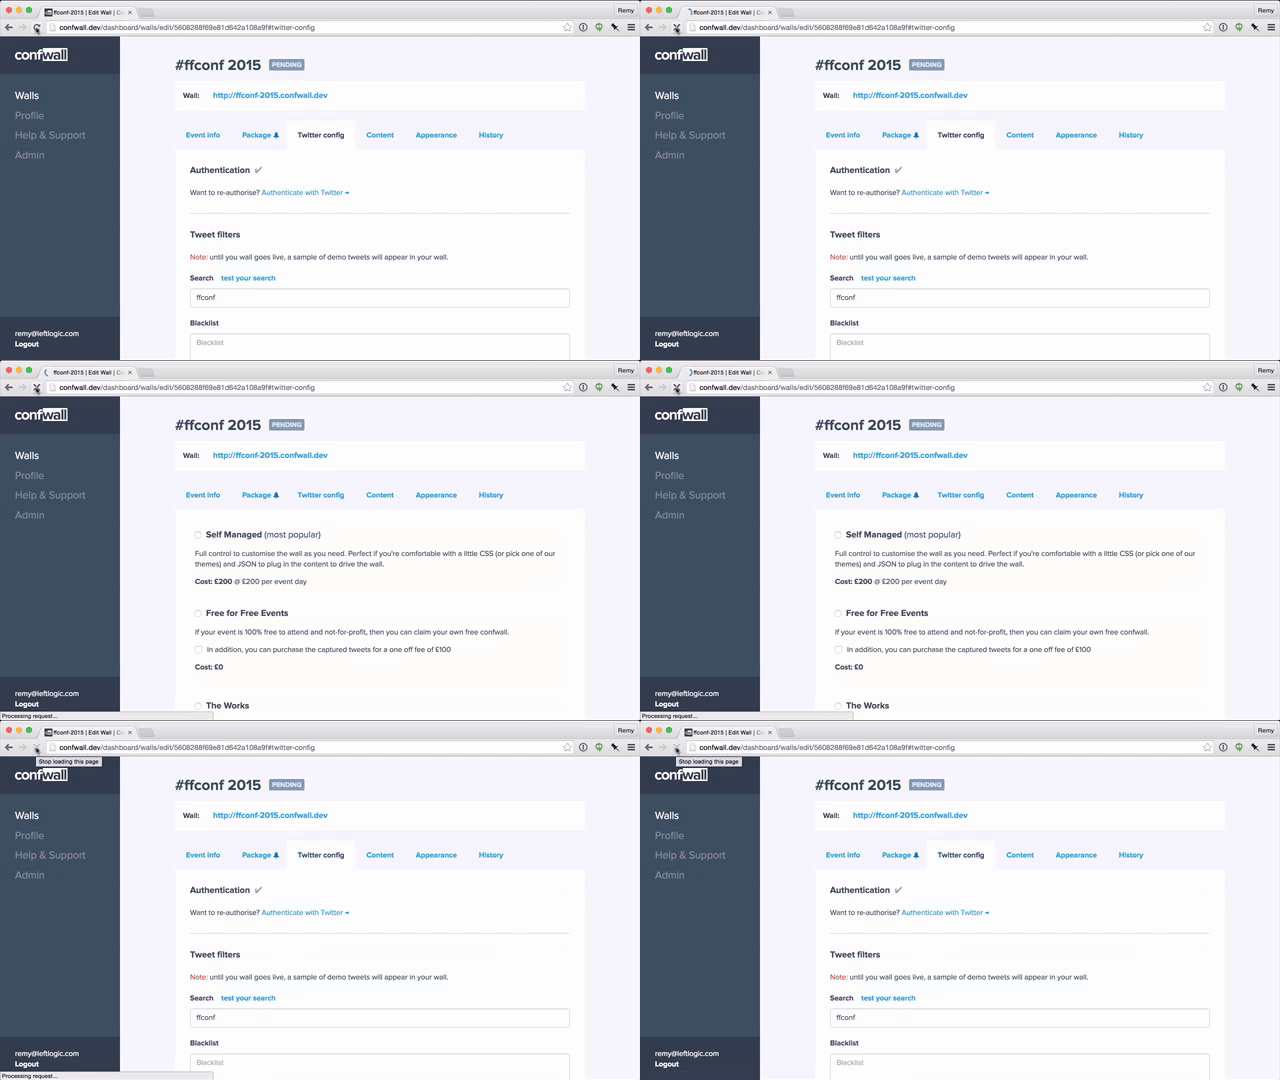
The second time was with my product confwall.com. The problem was that there was significant latency in loading the tabbing system. If you watch the animation below (running at 50% speed) you'll see the tabs are slow to render:

This is also captured in the rendering timeline via the "camera" icon:

From this, I could move the point in time where the tabs finally re-rendered into the right layout, and work backwards to find what was running and blocking.
Throttling
Throttling the network gives me a really quick view on emulating slow or entirely offline connections to get an instant view on the effect of a slower network.
A typical example is: what does my site with custom fonts look like over a slow connection? Is it blank for a long time? Are other assets holding up the font rendering? Is there anything I can do about it?
Network detail & reply
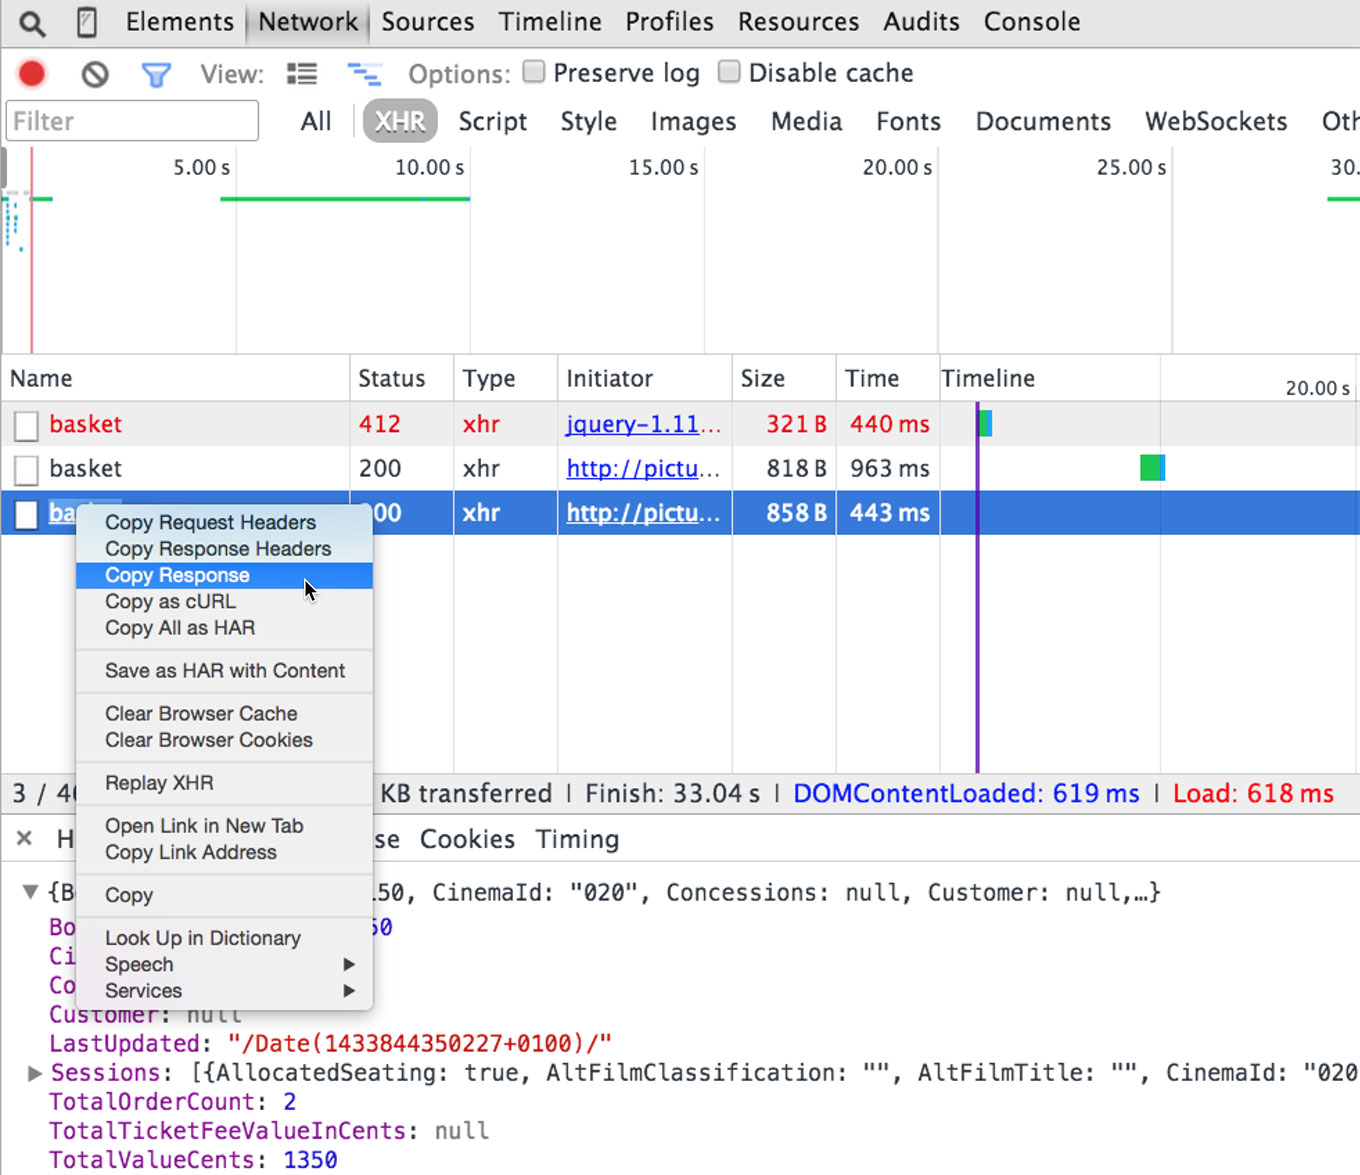
The visualisation of the network requests is useful, but I also find that inspecting headers and copying the raw response is extremely useful.

I've also found that when I'm debugging a server side bug where the response is incorrect (like sending HTML back instead of JSON), I can debug, fix and restart the server, and instead of refreshing my browser and blowing away the state and current stack - I can simply "Replay XHR" and my code will re-run the request, and (IIRC) the callback will fire with the updated server content.
Break on DOM changes
As I mentioned earlier, "break on DOM changes" is one way which I will debug from an outside in approach. I've used this plenty of times when I know there's a visual change, but I'm unsure what the source of that change is.
I do find it tricky to know exactly which "break on..." to use. Usually "break on attribute modification" is simple - i.e. if the className changes, the code will break. Otherwise, I tend to just select everything until the code breaks, and then I'll either step through or step backwards through the call stack.
An extra protip here is sometimes the call stack will be decapitated due to an async call. Devtools offers a feature (which is expensive on memory, so remember to turn it off) on the sources panel. Check the "Async" box and repeat the bug. You'll now have the full call stack across the asynchronous calls.
Surface scans for memory leaks
Finally, memory leaks are traditionally (for me certainly) the hardest part of debugging. In truth, I'll rarely look at memory unless I feel there's something jumping out at me. However, devtools has really advanced in the ease required to dig around for leaks.
There's two approaches I will take, fully informed by this excellent Chrome video from a few years ago:
- Surface tests looking at the staircase
- Using the profiling tools to capture clues to the source of the leak
The staircase effect is the first initial clue as to whether you have a memory leak. For me, the trick is to reliably reproduce the leaking effect. I'll personally start a timeline recording with "Memory" selected (and nothing else). I'll start the interaction, and before stopping, click the dustbin which forces a garbage collection, and then I'll repeat the process again, and then end the recording.
What I'm trying to do here is: establish the baseline memory use (the data before I start the interaction), run an interaction. If there's a significant amount of memory that couldn't be garbage collected, then I have a leak. Then onwards to profiling.

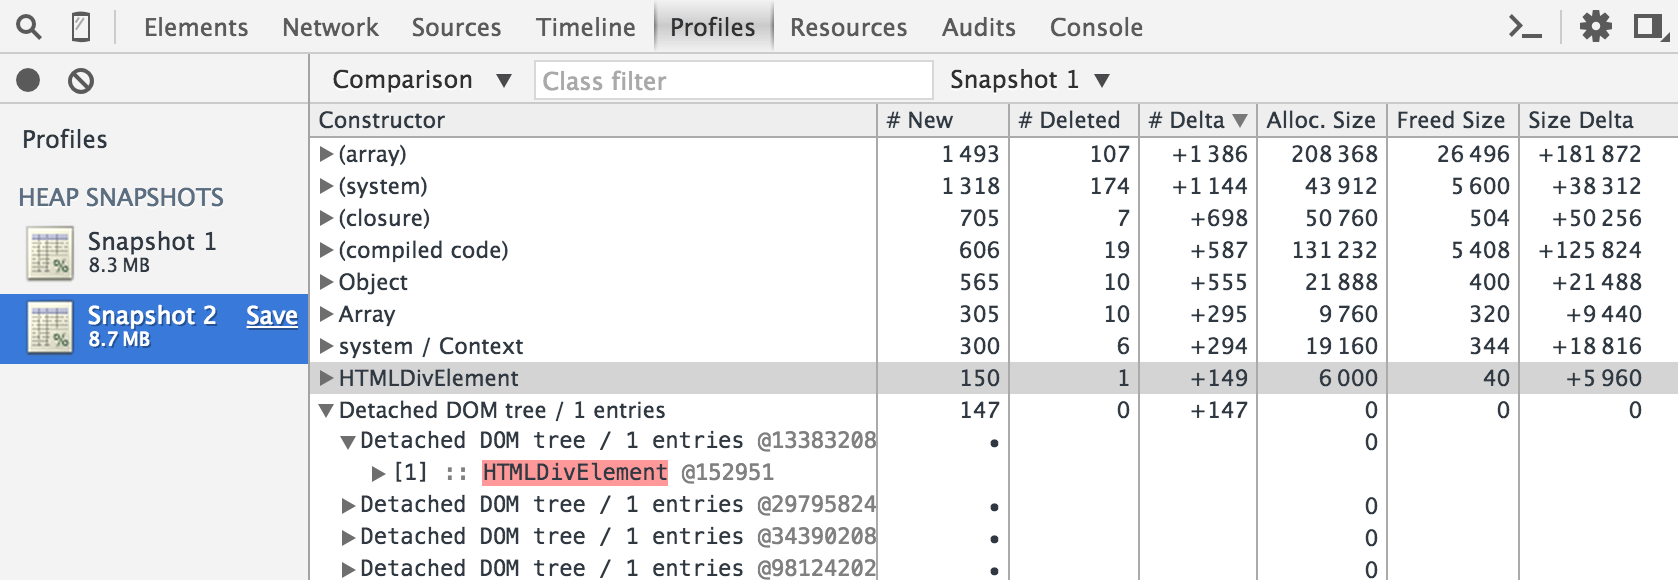
Profiling can take two approaches. The first is to capture two heap dumps, one at the start of the interaction, and one at the end. I might also run two interactions, but before I start the second run, I'll force a garbage collection. The task is then to compare the deltas. I'll select the second heap dump, and change it from a "summary" to "comparison" and order by "deltas". Now I'm looking for is red items in memory. These are items that couldn't be garbage collected.
This will then (hopefully) yield clues as to what is leaking. Usually DOM nodes, and what JavaScript references are still pointing to the nodes. Frustratingly it's usually inside a JavaScript library, so some knowledge of how libraries work helps a great deal.

Wrap up
As I said at the start, there's no silver bullet. I suspect many readers of this post will have skimmed right to the actionable parts and copy & pasted. Which is cool, I'd do the same.
Honing your debugging skills is a long game, directly linked to writing code which leads to the artefacts of bugs. Hopefully you'll jump at the chance of debugging too!
Remember, it's also worth taking a break from debugging too, many, many bugs have been solved without being near computers (long walks, showers, etc) - because computers can be a bit stressful sometimes too...!