Since I was stuck in a hotel for a day, I thought I'd poke around devtools and see if I can try applying some anti-jank techniques.
As usual, I bumped in to some problems, so I felt they were post worthy (if only for my memory). Annoyingly, I'd probably argue all the work I did was pointless, but I learnt some stuff on the way, so I figured I'd post it up anyway. And I hope the Clearleft folks don't mind me using their site as my guinea pig.

MY EBOOK£5 for Working the Command Line
Gain command-line shortcuts and processing techniques, install new tools and diagnose problems, and fully customize your terminal for a better, more powerful workflow.
£5 to own it today
Spotting the Margarine Effect
Okay, jank. I was browsing the Ampersand 2013 conference site. It's a lovely site to look at, but I noticed in Chrome it judders, just a bit, but it judders, so I wanted to dig in and see if I could identify what was causing the issue, and if I could apply a fix.
Though to be fair, as with most solutions, speaking to someone with more perspective helps/solves the issue - in this case Jake Archibald came up with the goods, but I'll get on to that later.
Identifying the issue
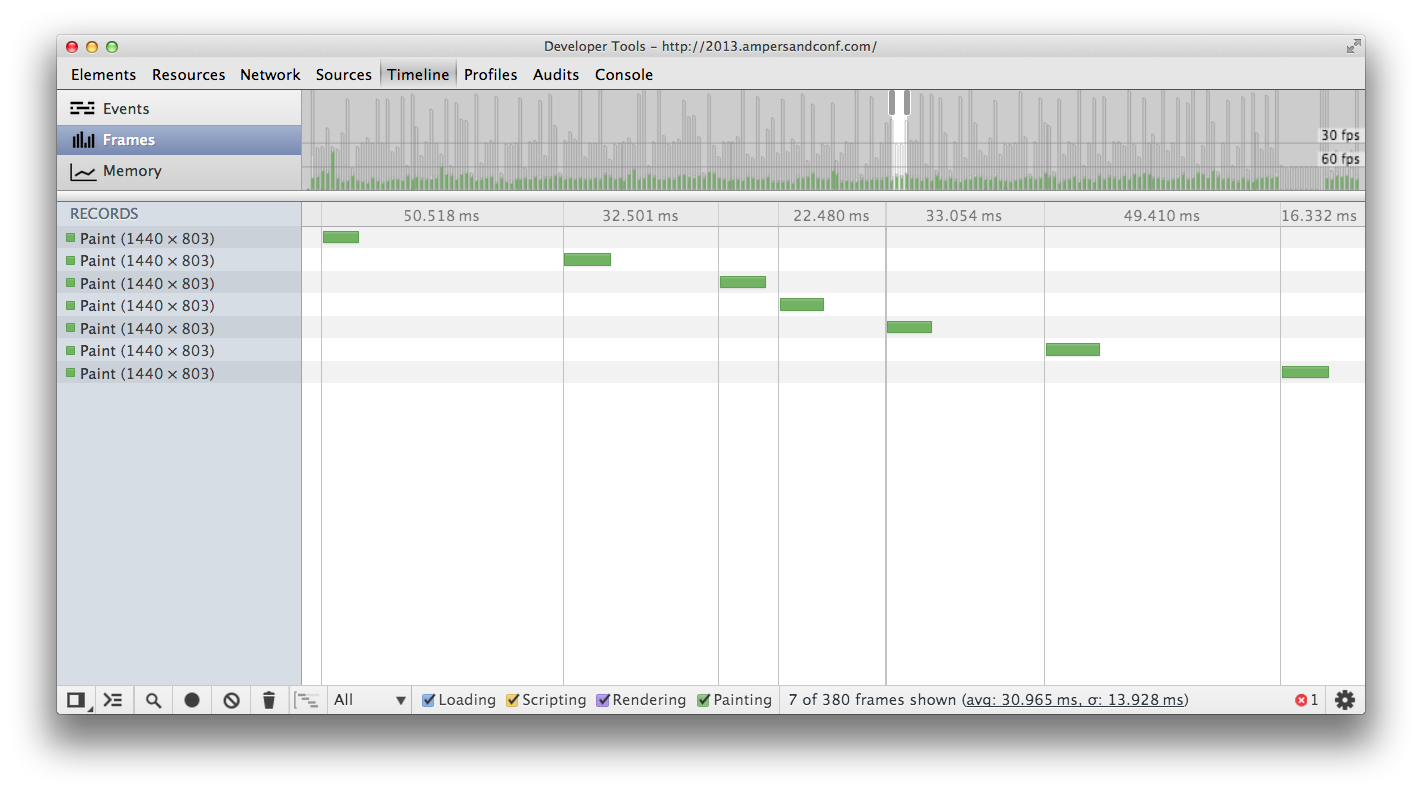
The first thing I turned to was the timeline tool in devtools. I recorded the timeline, and I can see the frames are rendering around every 30ms, which gives me ~30fps which is why I could see some juddering. The sweet spot is being in sync with the monitor refresh rate, which is usually 60hz, which approximately translates to 60fps - so one frame per screen render is 1000ms / 60 = 16.666ms - but let's say we're always aiming for 16ms for a frame*.
* It's quite possible I'm making this all up - but it sounds like it fits!
The timeline initially looked like the following when recording and scrolling - note there's just the paint, and nothing else appearing to go on:
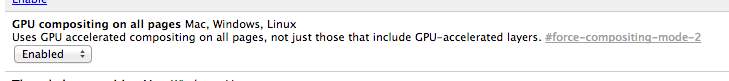
To get a fuller picture, we need to enable "GPU compositing on all pages" in chrome://flags.
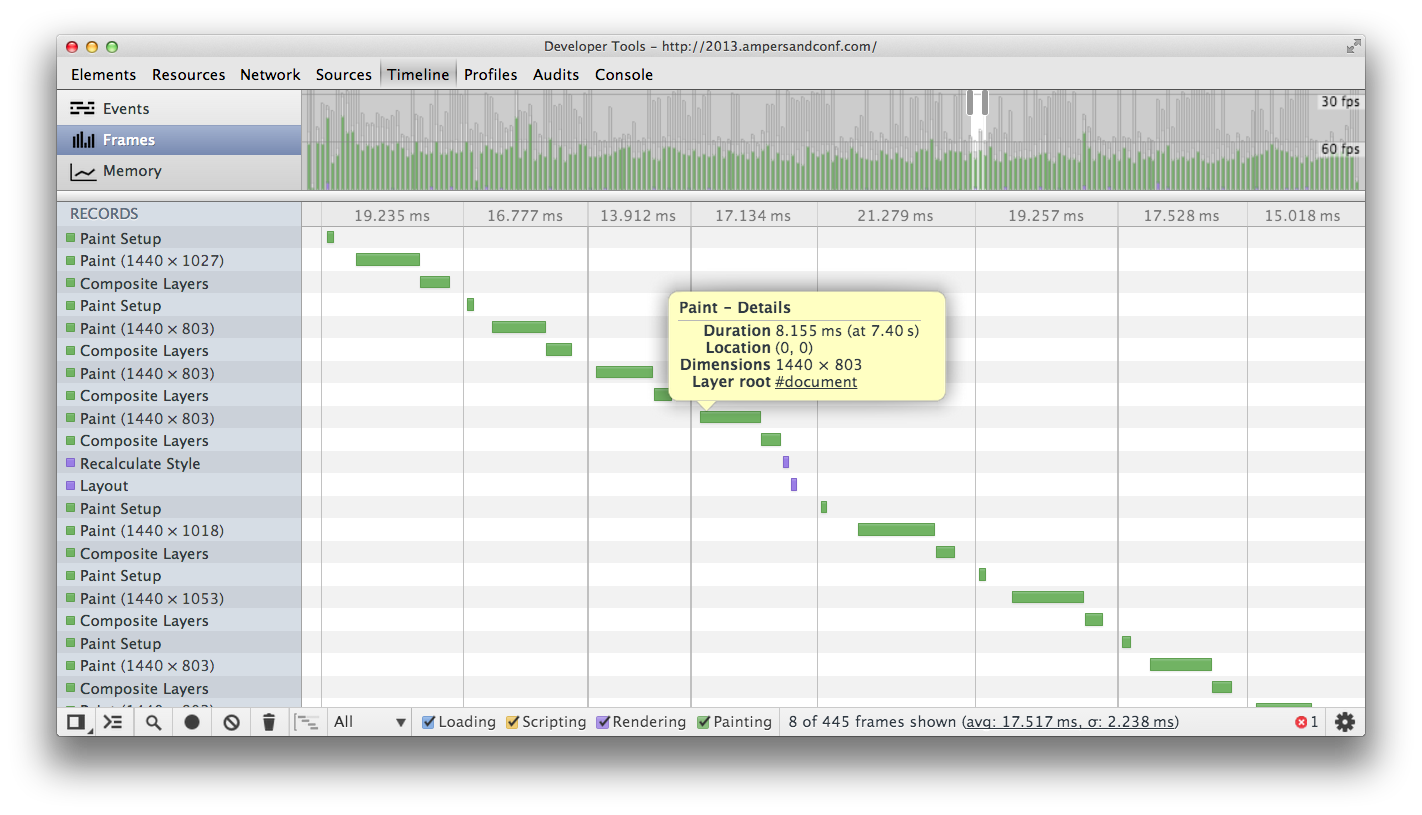
Now the same timeline recording looks like the following - note that we now have the composite task, and when I hovered over I could see this was taking around 10ms, that with the paint and anything else is pushing us over the golden 16ms, so it's getting rendered in the next tick:
I can also turn on the CPU activity on the "ruler" (not to be confused with the ruler on the elements panel, the "ruler" is the strip in the timeline that show the frame time) (enabled via devtools settings):
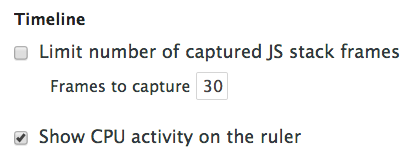
Which confirms the frame is too big.
But why?
Seeing the cause
From the composite I can see it's the full window being rendered (because I can see the dimensions of the draw). I can also visualise this on the web page (rather than looking at the timeline) by ticking the 'show paint rectangles' in the rendering section of the devtools settings:
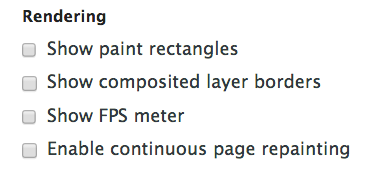
Note that if you want lots of visual feedback, you want to make sure the GPU compositing is enabled (as I explained earlier).
Now when I scroll the page, those parts that are painting, are highlighted in red:

So the whole page is being re-drawn.
This actually comes down to the background-attachment: fixed on the background image. How do I know that? I watched Jake give a talk at Mobilism 2013 (video to be added soon), and in fact I asked him.
Though I could have narrowed it down eventually since devtools was telling me something the size of the entire page was causing the painting.
The fix
The fix is to move the problem to it's own composited layer. Again, thanks to Jake for this tip, he suggested putting the background image in it's own layer with translateZ(0) applied. So a new div was inserted with the following CSS:
left: 0px;
right: 0px;
bottom: 0px;
top: 0px;
position: fixed;
background-image: url(/images/brighton-bkg.png);
-webkit-transform: translateZ(0);
pointer-events: none;
Now we want to check the change actually made a difference.
Confirming the change
The first thing I did was to return to the timeline tool and record. Indeed I could see the composite time had reduced down - from about ~10ms to ~2ms - which gives us more room in the 16ms frame. Except there's something else going on consuming the rest of the time and the frames were between 30-60fps.
So I know the change was an improvement, but was it entirely worth it? I'm not 100% sure.
There is another tool I also discovered that's useful for changes: the "show fps meter":
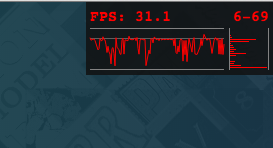
I used this before the change and after I noticed a subtle difference. It's in the histogram on the right (which took me a while to figure out).
The range from bottom to top is the distribution of fps (over how long I'm not sure). If it's bottom heavy, then I know it generally has a slower fps - in this case it looked like approximately 20fps. After the change the distribution changed, and moved more to 60fps with some sitting on 30fps - but it was starkly different, rather than bulging at the bottom.
Special thanks to Jake for proofing this post.