In preparing for my new Node workshop (tickets go on sale Wednesday 10am - set alarm!) my tool of choice used to be node-inspector but development has gone idle (for a year to date) and it's showing it's age. However, recently I came across tracegl I was intrigued as it looked to add to my debugging tools for Node.
tracegl was so much more than I realised: it captures full JavaScript state a all points of my application's execution - both on the server side, but also the client side.
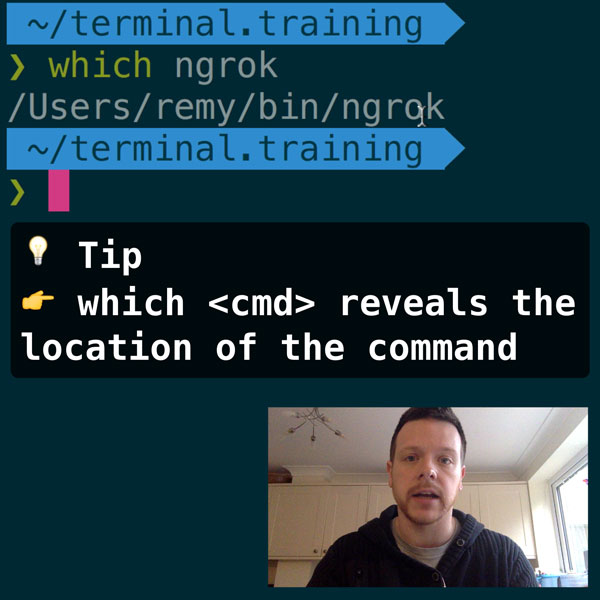
READER DISCOUNTSave $50 on terminal.training
I've published 38 videos for new developers, designers, UX, UI, product owners and anyone who needs to conquer the command line today.
$49 - only from this link
Debugging a real bug with tracegl
Rik Arends includes an introductory video on the site, and the script is €12 - which frankly is a steal for what it provides me. If you're join my Node workshop - I'm proving a licensed copy for everyone (because I think it should be part of your core stack).
I've included a short video of how I've used tracegl to debug my server side application. A few important things to note are: the trace is historical - and not blocking execution, which is what I'd normally do if I had to debug: I'd carefully replicate the issue, then either add a conditional breakpoint or debugger statement - but with tracegl, the bug can occur, and if tracegl is running, I can just look back at the state of the problem.
Learning more
I'm running a new crash course in Node on July, and similar the past it's known to have sold out in a week. Tickets go on sale on Wednesday at 10am (UK) and will be available here.
I'll be using this tool and many others to give you a fully packed day of knowledge on how to use Node, how to develop sites and real-time applications, and what tools I use for debugging, publishing and deployment.
So grab a ticket if you want my hands on, "knowledge smash & grab" course (or check out more details here).